November 2008
In This Issue
Your processes produce a service or a product. But, these processes also produce data. And Statistical Process Control (SPC) is simply taking those data and using them to make your processes do what you want them to. What are the processes in Customer Service? Simply what your customer service people do – answering the phone, answering customer questions, placing orders, quoting, expediting orders, asking for the “fries,” to name a few. This month’s newsletter examines how SPC applies to Customer Service.
Measures in Customer Service

In Customer Service what should you measure and work on improving? You want to measure things that the CSR can impact and control to some degree. For example, suppose a customer calls and wants a quote on a 100 different line items. What does the customer want from this quote (in Six Sigma terms, the CTCs or critical-to-customer)? Obviously a good price (beyond the CSR’s control in most cases), but the customer also wants the quote to be accurate and timely. Thus, there are two items that are potential measurements for a CSR: the accuracy of the quote and the time to complete the quote.
Yes, these are more difficult to measure than the end of the line items. Get used to it. The critical in-process measurements in service organizations are seldom easy to collect. It is amazing how many organizations won’t collect data because it is difficult to do. “Yes, that data would help us, but it is too difficult and takes too long to collect.” There is no logic in that. Are these companies willing to live with long term inefficiencies instead of taking some time to fix the problem or improve the process? You can’t improve if you don’t have the data to guide your improvement efforts. But remember, you don’t have to collect everything. You can sample the process over time.
Here is another example. When a customer calls in with a question, what do you think the customer wants (the CTC)? Same as you do when you call a company with a question. You want it answered correctly on the first call. Again: two potential measurements for the CSR: correct answers and % of questions answered on the first call.
Many call centers use the length of a phone call as a measurement. They want to decrease this so fewer representatives can handle more phone calls. But, that doesn’t address a key customer need – getting the right answer the first time you call.
There are many things that you can measure and improve in Customer Service. The key is finding those measures that the CSR can impact and that are critical to the customer.
Determining CSR Measures

- Brainstorm a list of all the things a CSR does (be sure to include your CSRs).
- Rank them in importance from the customer’s viewpoint (be sure to ask your customer, if you haven’t already).
- Take the top three and determine what is critical-to-customer in each one.
These become your metrics. Below are some examples from various companies with the type of chart they used to monitor the process.
Quoting
- Time to complete the quote (Individuals control chart)
- Accuracy of quote (p control chart)
Customer Response Time
- % of time the phone is answered by a person (Individuals control chart)
- Calls per hour of the day (Histogram)
- % of time the customer’s question is answered on the first call (p control chart)
Entering Orders
- Accuracy of order (p control chart)
- % of orders entered completely on day of receipt (p control chart)
- % of orders expedited on-time (p control chart)
- % of orders not expedited (p control chart)
Additional Sales
- Additional sales dollars per week generated by asking for the fries –“Would you like this in addition to that?” (Individuals control chart)
The challenge then becomes how to take the data. In many cases, it will be manual collection, but once again, remember, you can sample and not measure everything.
Examples
We will look at two examples from the above data.
Quoting
Data collection on quotes was confined to quotes that couldn’t be answered on one phone call. For example, if a customer called in and wanted a quote on one item (for example, a ladder), this should be done on that phone call. But quotes that required a CSR to hang up, find the information, and contact the customer, take some time. In addition, some quotes had many line items, while others had a few items. It was decided that the measure would be the time/line item for these quotes.
A data collection sheet was developed for each CSR. The data collection sheet has the following information:
-
Quote Number
-
Date
-
Time Call Ended (this is the start of the time)
-
Number of Line Items
-
Time Quote Returned to Customer (by phone call, fax, or e-mail)
-
Total Time
-
Time per Line Item
-
Comments
Each CSR would manually fill out this form, In reality, it is easier if each CSR keeps his or her data in an Excel spreadsheet. Each individual spreadsheet is then linked to a master Excel workbook. This makes the calculations easier plus it allows multiple CSRs to work on the same quote number and to account for their time.
The total time for the quote only included business hours. If a call ended at 1 PM and the quote was returned to the customer at 10 AM on the following day, the total time was 4 hours on day 1 and 2 hours on day 2 for a total of 6 hours. This assumes a work day of 8 AM to 5 PM. Overtime could be accounted for also.
Note: You are not measuring the actual time that the CSR spends working on the quote. The CSR is doing many things. You are measuring the time it is going to take the CSR to get back to the customer based on the number of line items in the quote.
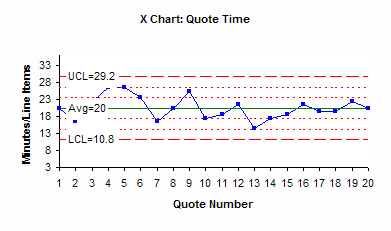
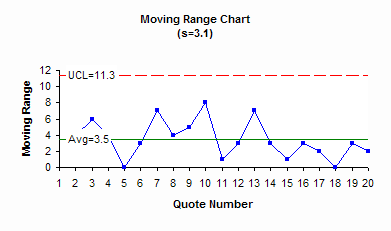
An example of an individuals chart for quote time is shown below. The X chart is the top chart.


It shows that it takes on average 20 minutes per line item to do a quote. The process is in statistical control. This means that it is consistent and predictable. If a customer calls in with a 100 line item order, you can predict on average how long it will take to get the quote back to the customer:
(20 minutes/line item * 100 line items )/(8 hours/day * 60 minutes/hour) = 4.2 days
So, do you tell the customer he will have the quote in four business days? No, remember that is the average. From the X chart, the time per line item can vary from 10.8 (the lower control limit) to 29.2 minutes (the upper control limit). Use the upper control limit for the time the quote will be returned to the customer:
(29.2 minutes/line item * 100 line items )/(8 hours/day * 60 minutes/hour) = 6.1 days
The quote will always be returned to the customer on time as long as the process stays the same (no special causes).
Note: It is does not mean that the 20 minutes per line item is acceptable. This is just what the current process does. If management does not like this, the process must be fundamentally changed for improvement to occur. But, you know what the current process is capable of producing.
Number of Calls per Time of Day
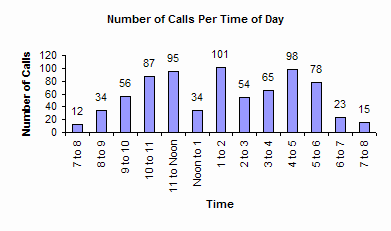
A company was interested in determining CSR staffing needs based on the number of calls coming in per hour. Their phone system allowed them to track incoming calls by time. They took data for a two month period and determined the average number of calls per hour based on their hours of operation. They used the data to make the histogram shown below.

Early in the morning and late in the evening, there are not that many calls. But the calls spike in late morning, early afternoon and just before closing. This information can be used to determine when to schedule breaks or when to add additional people to help answer phones.
Summary
SPC works, plain and simple. The challenge is to determine what data need to be collected to provide feedback to those closest to the job. Customer service is no different. There are customer service processes that can be monitored and improved. The examples above just touch the surface of what could be done.