December 2011
 As 2011 draws to end, we hope that you had a wonderful year both in your personal life and your work life. And, we wish you a Happy New Year and the best of luck in 2012. This marks the end of our 8th year of monthly newsletters for us – this is number 96. We hope you have enjoyed the newsletters over the years and that the information in them has been helpful to you.
We close this year’s newsletters with one on how to use SPC in tracking uptime and efficiency. Equipment downtime in a plant is almost always an issue, particularly if the downtime occurs at the bottleneck in the plant. This newsletter describes how to track downtime (and overall equipment efficiency) using control charts and Pareto diagrams.
Uptime by itself does not tell the full story. You can be up 100% of the time one day, but if you are running at half of what the equipment can do, you are really not performing very well. If you are simply reworking product, you are not adding to the income of the company. So, we also go beyond just uptime and include the rate at which the line is running, the planned “not scheduled” time, and the rate of quality product to determine an overall efficiency. You will find this called the Overall Equipment Effectiveness in the literature.
In this issue, we answer the following questions:
- Do I track individual pieces of equipment, a production or the entire plant?
- How do I determine the reasons for downtime?
- How do I collect the data?
- How do I define uptime?
- How do I define availability?
- How do I define the rate of quality product?
- How do I define the performance efficiency?
- How do I define the overall equipment efficiency?
- How do I present the results?
- How do I improve the results?
- What are some potential goals?
- Summary
- Quick Links
We will talk about uptime/downtime to start with and then expand to the overall efficiency. You may leave a comment at the end of the newsletter.
Uptime on Equipment/Lines
The first step is to decide what you want to track. You want to track the uptime on the machines/equipment that are critical to the throughput in the plant, i.e., when the machine is down, the production in the plant will be down. If a machine is independent and goes down without taking down other parts of the plant, you would track the uptime on that individual machine. However, if there are machines that are linked together in a production line, you would track the uptime of the entire production line.
If the machine is not important to plant throughput, don’t track its uptime. For example, suppose you have a mill that is used to prepare production samples for testing. If that mill goes down, will it limit plant production? It might if the sample has to be tested before the production run. In that case, it is a critical piece of equipment. However, if there is a spare mill that can be use, it is not critical and you would not track its uptime.
So, the rules are:
- Track only those machines/production lines that are critical to the throughput in the plant.
- If the machine is independent of other machines, track the uptime for that individual machine.
- If the machine is part of a production line, track the uptime for the entire production line.
Downtime Reasons
Knowing the uptime on machines/production lines is important. But if you are going to want to improve that uptime (which you will want to do), you need to know the reasons for downtime. This means you will have to collect data not only on the time you are up and running but on the time you are down and the reasons for the downtime.
The reasons for downtime vary immensely depending on your process. You will want a list of reasons for downtime. This is best accomplished by meeting with those who are closest to the process (e.g., the operators) and brainstorming a list of downtime reasons. This list will be a starting point for you and will need to be revised over the next few months as you gain experience on tracking the reasons for downtime.
It is helpful to think about how downtime can occur due to three major areas: mechanical, process, and people. Mechanical reasons include equipment breakdowns such as pumps failing, belts breaking, etc. Process reasons include things such as sampling, moving material, waiting on material, setting up a machine, etc. People reasons include the machine not being scheduled, meetings, lunch, etc. You will most likely want to develop “downtime codes” for each reason to facilitate data recording.
You might also want to have codes for uptime. For example, you are up and running when you are making the product for the first time. But you are also up and running when you are reworking product that is out of specification. You might want different uptimes code for those types of situations.
Collecting the Data
How you collect the data depends on your setup. You might be able to automatically detect when equipment is running. But in the end, when a machine is down, someone has to decide why it is down and record the reason for the downtime – either manually or into a computer. Obviously, the more information you can enter into a program, the easier the analysis will be. Even if you don’t have a fancy computer system, you can set up something in a database (e.g., Access) or spreadsheet (e.g., Excel) to do the analysis.
You will need to decide how often you collect the data. If you run 24 hours a day, 7 days a week, collecting data in 15 minute intervals is usually sufficient. You can set up an Excel spreadsheet, for example, as the table shown below.
Table 1: Spreadsheet Example for Downtime Data Collection
| Time | Material | Customer | Uptime Code | Downtime Code | Comments |
| 12:00 AM | |||||
| 12:15 AM | |||||
| 12:30 AM | |||||
| 12:45 AM | |||||
| 1:00 AM | |||||
| 1:15 AM | |||||
| 1:30 AM | |||||
| 1:45 AM | |||||
| 2:00 AM | |||||
| 2:15 AM | |||||
| 2:30 AM | |||||
| 2:45 AM | |||||
| 3:00 AM | |||||
| 3:15 AM | |||||
| 3:30 AM | |||||
| 3:45 AM |
An operator would simply record if the machine/line was up during that 15 minute period or, if it is down, the reason code for why it is down. Always leave a space for comments from the operator in case there is something special the operator wants to enter.
Beware that it will take time to work out the data collection. It will not be perfect at first and will need to be revised over time.
Below we develop the definitions on which to base the calculations. It is best to calculate the data daily so you will be looking at daily results.
Uptime
Uptime is simply the number of hours you are up and running each day. It can be running product for the first time or rework. But anytime the machine or line is up and processing material, it is uptime.
Availability
The availability of a machine/line is defined as the following percentage:
% Availability = 100(Uptime/Loading Time)
where loading time is the total available hours minus any not scheduled or other idle time. Since we are talking about taking the data daily, the total available hours are 24. The not scheduled time is included so you are not punished for things beyond your control. Not scheduled includes no material to run, holidays, experimental runs, etc.
For example, if you were scheduled to run all 24 hours and had 18 hours of uptime and 6 hours of downtime, your % availability for the day would be:
% Availability = 100(Uptime/Loading Time) = 100(18/24) = 75%
If you had four hours planned down because there was no material, then your % availability for the day would be:
% Availability = 100(Uptime/Loading Time) = 100(18/(24-4))= 100(18/20) = 90%
Planned downtime for maintenance is not considered “not scheduled.” This should be included in the scheduled hours.
Rate of Quality Product
The rate of quality product is fairly straight forward. It simply is the ratio of good product to total product for the time period. If we are looking at daily results, it is that ratio for the day. So, assuming you just have the two possibilities of scrap and rework, the rate of quality product based on weight is:
Rate of Quality Product = (Run Weight – Scrap Weight – Rerun Weight)/Run Weight
You could also base the rate of quality product on pieces instead of weight. It will depend on your particular situation.
Continuing with our example above where our % availability was 90. Suppose that the capacity of our machine/line is 1000 pounds per hour. During the 20 hours we were up that one day, we ran 18,900 lbs. Of that, 150 pounds were reworked and 50 pounds were scrapped. The rate of quality production is then:
Rate of Quality Product = (18,900 – 150 – 50)/18,900 = 0.989 or 98.9%.
Performance Efficiency
Performance efficiency compares what you ran to the best run rate. The best run rate could be the equipment capacity or the “ideal” based on everything working correctly. The “run weight” includes all material – good and bad. So, the % performance efficiency is:
% Performance Efficiency = 100(Run Weight/Uptime)/(Best Run Rate)
We will continue with the example above. We ran 18,900 pounds in 20 hours. The best run rate is 1000 pounds per hour. So, the performance efficiency is:
% Performance Efficiency = 100(18900/20)/(1000) = 94.5
Overall Equipment Effectiveness
The overall equipment effectiveness (OEE) is a combination of the availability, rate of quality product and performance efficiency.
Overall Equipment Efficiency = Availability x Rate of Quality Products x Performance Efficiency
So, for our example, the overall equipment efficiency is given by:
Overall Equipment Efficiency = 0.90 x 0.989 x 0.945 = 0.841 or 84.1%
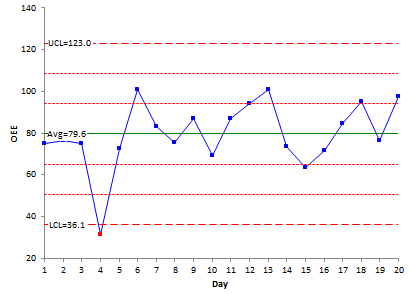
Using Control Charts to Display the Results
The availability, rate of quality product, performance efficiency and the overall equipment effectiveness should each be displayed on their own control chart. The control chart allows you to see the underlying variation for each metric and to see how the metric changes over time – is it increasing, decreasing or staying the same. The individuals chart (X-mR) is the best chart to use for this. Each chart will show its normal range of variation and point out special causes when they occur.
Let’s take a look at some example data. The data in the table below shows our results for 20 days. The collected data includes day number, uptime hours, loading time, pounds of product, and pounds of rework and scrap. The other numbers are calculated as shown above.
Table 2: Uptime Results
| Day Number | Uptime Hours | Loading Time | % Availability | Lbs Product | Lbs Rework and Scrap | Rate of Quality Product | Performance Efficiency (Best Rate = 1000 lbs/hr) | OEE |
| 1 | 20.25 | 24 | 84.4 | 19850 | 1830 | 90.78 | 98.0 | 75.1 |
| 2 | 19.75 | 24 | 82.3 | 19160 | 790 | 95.88 | 97.0 | 76.5 |
| 3 | 21.00 | 24 | 87.5 | 18900 | 870 | 95.40 | 90.0 | 75.1 |
| 4 | 8.75 | 24 | 36.5 | 8710 | 1150 | 86.80 | 99.5 | 31.5 |
| 5 | 17.25 | 24 | 71.9 | 18110 | 740 | 95.91 | 105.0 | 72.4 |
| 6 | 23.25 | 24 | 96.9 | 25110 | 900 | 96.42 | 108.0 | 100.9 |
| 7 | 22.75 | 24 | 94.8 | 20480 | 510 | 97.51 | 90.0 | 83.2 |
| 8 | 18.25 | 24 | 76.0 | 19530 | 1390 | 92.88 | 107.0 | 75.6 |
| 9 | 21.25 | 24 | 88.5 | 22950 | 2070 | 90.98 | 108.0 | 87.0 |
| 10 | 16.50 | 20 | 82.5 | 15020 | 1170 | 92.21 | 91.0 | 69.3 |
| 11 | 21.25 | 24 | 88.5 | 22530 | 1670 | 92.59 | 106.0 | 86.9 |
| 12 | 24.00 | 24 | 100.0 | 23520 | 920 | 96.09 | 98.0 | 94.2 |
| 13 | 23.50 | 24 | 97.9 | 24440 | 270 | 98.90 | 104.0 | 100.7 |
| 14 | 18.50 | 24 | 77.1 | 19430 | 1730 | 91.10 | 105.0 | 73.8 |
| 15 | 13.50 | 20 | 67.5 | 13770 | 1050 | 92.37 | 102.0 | 63.6 |
| 16 | 19.25 | 24 | 80.2 | 18870 | 1720 | 90.89 | 98.0 | 71.5 |
| 17 | 22.75 | 24 | 94.8 | 20480 | 160 | 99.22 | 90.0 | 84.7 |
| 18 | 23.00 | 24 | 95.8 | 25070 | 2230 | 91.10 | 109.0 | 95.2 |
| 19 | 19.50 | 24 | 81.3 | 19890 | 1570 | 92.11 | 102.0 | 76.3 |
| 20 | 22.50 | 24 | 93.8 | 24080 | 630 | 97.38 | 107.0 | 97.7 |
The four calculated metrics will now be charted. These are the four that we want to monitor over time. The four control charts are shown below.
Figure 1: Availability
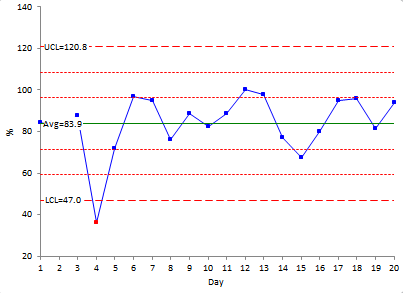
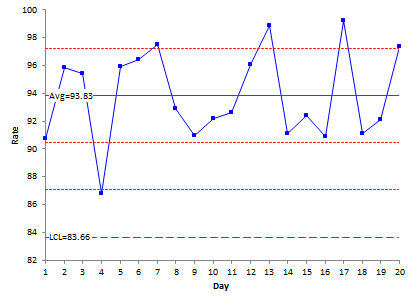
Figure 3: Performance Efficiency
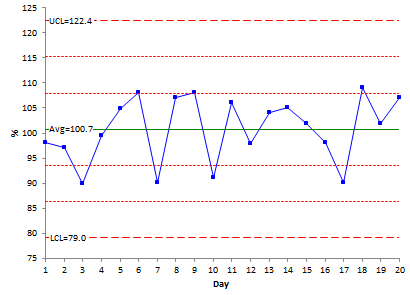
Figure 4: Overall Equipment Effectiveness
How to Improve the Results
You use the control charts to guide your process improvement efforts. If you are new to control charts, please take a look at our newsletter on the purpose of control charts. If there are any special causes of variation, the reasons for the out of control points should be found and eliminated. Note that there is one out of control point on the availability control chart. Something happened that caused the machine/line to be down longer than “normal.” The reason for this should be found and eliminated. This also created the out of control point on the OEE chart.
Once the process is fairly stable, you can determine which metric needs to be worked on first. Many times it will be the availability metric. You should be keeping a Pareto diagram on reasons for downtime. This chart will help you determine the major reasons for downtime and which reason should be worked on first (our newsletter on Pareto diagrams is here).
Potential Goals
The objective is always to continually improve over time. However, leadership seems to like to have some goals to work towards when you first start. Those goals are up to you and depend on your situation. However, here are some recommendations to get you started.
- Availability: greater than 90%
- Rate of quality product: greater than 99%
- Performance Efficiency: greater than 95%
Summary
This newsletter has shown how you can use SPC to monitor downtime/uptime in a plant. In addition, we went a step further to include the three components of overall equipment effectiveness: availability, rate of quality product, and performance efficiency. The best control chart to use to monitor these metrics is the individual control chart. In addition, a Pareto diagram should be kept on the reasons for downtime.
Thank you for articles written this year. They are written at a level of understanding accessible, which is very good. Practically every article made me remember the fundamentals of SPC, at least, if you have taught me something new.
For 2012, I wish you a happy New Year, with many interesting articles.
Nicholas DARABAN
Thanks for your excelent articles during these years. They are very effetive.
Lafayette U Tenorio
Performance efficiency in unit lbs/hours or as %?
In table 2 the Performance efficiency is stated in units lbs/hours uptime, and not as % of Best Run Rate. This must have confused the author, and consequently give wrong results for the OEE chart. The average OEE is 7.96%, not 79.6%. Recalculate column 8 (Perfomance efficiency) to % of Best Run Rate before calculation of OEE in column 9. I think that OEE cannot be larger than 100% (see days 6 and 13)!
I read your articles and appriciate this kind of educational service!
Best regards
Helge Karlsson
Performance efficiency is a % given as:
% Performance Efficiency = 100(Run Weight/Uptime)/(Best Run Rate)
where Best Run Rate has the same units as Run Weight/Uptime. So, if run weight is in lbs and uptime is in hours, the best run rate is also in lbs/hour. In the example, the best run rate is 1000 lbs per hour. If you run higher than this, the %PE can be greater than 100. So, OEE can be greater than 100 also.
I think what confused the situation is that the lbs product (and lbs rework/scrap) had a zero left off their data in Table 2. That has been corrected as of today (1/5/12).
Thanks for the kind comments.
Best Regards,
Bill