April 2022
(Note: all the previous SPC Knowledge Base in the process capability category are listed on the right-hand side. Select this link for information on the SPC for Excel software.)

You send the report off to the customer’s Quality Manager via email. Later in the day, you get an email back from the customer saying that the Cpk does not meet their requirements. The confidence interval for Cpk, the Quality Manager writes, is 1.30 to 1.50. This interval contains values less than 1.33, so it is possible that the “true” Cpk is less than 1.33. But the Cpk was 1.40 you say. What is going on? The process is in statistical control.
What is going on is called variation. You have to understand variation if you are going to interpret data correctly. Everything varies, including Cpk values. This publication examines why Cpk varies and how this variation can be handled and understood in particular through control charts and confidence intervals. A simulation is used to help understand this. In this issue:
- Common and Special Causes of Variation Review
- Process Capability (Cpk) Review
- The Data
- The Simulation
- Cpk and the Simulation
- Cpk and Confidence Intervals
- When to Recalculate Cpk
- Summary
- Quick Links
You may download a pdf copy of this publication at this link. Please feel free to leave a comment at the end of the publication.
Common and Special Causes of Variation Review
There are two types of variation from a control chart standpoint: common and special causes. Common causes are the normal variation in the process. Common causes occur due to the way the process was designed and is managed on a day to day basis. Common causes of variation are consistent and predictable – within a range. For example, think about how long it takes you to get to work. It is not an exact time each day; it is a range of values such as 25 to 35 minutes. This is the “normal” variation in your process.
Special causes of variation are not part of the process – they are not supposed to be there. For example, if you have a flat tire on the way to work, you will not get there in the normal range of 25 to 35 minutes. Special causes are not predictable, but they are easy to identify.
The control limits on a control chart define the range of common causes of variation. The upper control limit (UCL) is the largest value you would expect from the process if only common causes of variation are present. The lower control limit (LCL) is the smallest value you would expect. As long as all the points are within the control limits and there are no patterns, the process is in statistical control – it is consistent and predictable.
The data we will be looking at in this article represent a process that is in statistical control – it is consistent and predictable. For more information on variation, please see our SPC Knowledge Base articles on variation.
Process Capability (Cpk) Review
Cpk is reviewed here. For more information on this (and on Cp, Pp and Ppk), please see our process capability articles in our SPC Knowledge Base. You can also see one of SPC Insights video What is Process Capability Measuring?
Process capability answers the question of how well a process meets customer’s specifications. Cpk takes into account where the process is centered. The value of Cpk is the minimum of two process capability indices. One process capability index is Cpu, which is the process capability based on the upper specification limit. The other is Cpl, which is the process capability based on the lower specification limit. Algebraically, Cpk is defined as:
Cpk = Minimum (Cpu, Cpl)
Cpu=(USL –X )/3σ
Cpl= (X – LSL)/3σ
where USL is the upper specification limit, LSL is the lower specification limit, X is the overall process average, and σ is the process standard deviation estimated from a range control chart. Note that σ is not the calculated standard deviation.
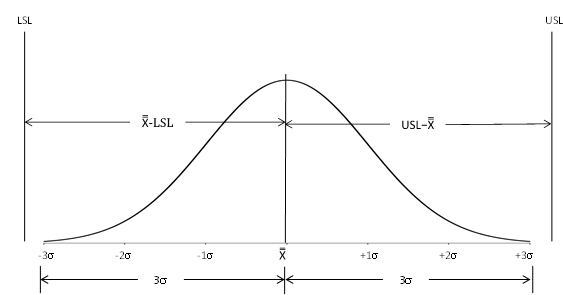
Figure 1 shows how the Cpk values are calculated. For the area below the average, it can be seen that the Cpl is simply the ratio of X – LSL to 3σ. If that ratio is greater than one, the LSL is more than 3σ from the average. Likewise, Cpu is simply the ratio of USL – X to 3σ. If that ratio is greater than one, the USL is more than 3σ from the average. Cpk is the minimum of Cpu and Cpl. So, if Cpk is greater than 1, then no product is being produced out of specification on the high or low side. Yes, there is a small percentage of the normal curve outside +/- 3σ. This is why more and more customers are demanding higher Cpk values, e.g., 1.33.
Figure 1: Cpk Index
The Cpk calculations require that your process be in statistical control and that the individual measurements are somewhat normally distributed. The issue of statistical control is ignored too often when calculating Cpk values. If there is only one specification, the value of Cpk is either Cpu or Cpl, whichever is appropriate for the specification. So, if there is only a USL, then Cpk = Cpu. Likewise, if there is only a LSL, the Cpk = Cpl.
The Data
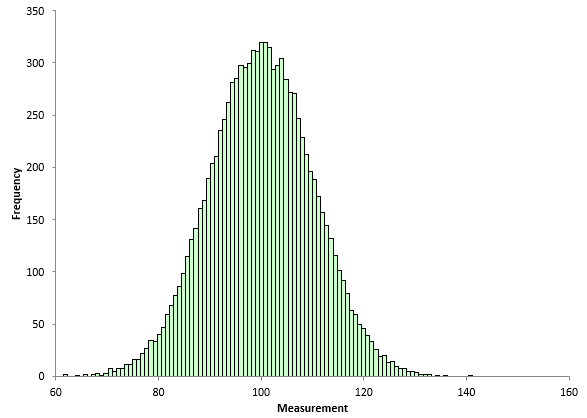
To explore the issue of Cpk and variation, a database was created that has 10,000 points. These points were generated using the random number generator in our SPC for Excel software. A normal distribution with a mean of 100 and standard deviation of 10 was used. This database represents the population for the process – all possible outcomes. The histogram of the 10,000 points is shown in Figure 2.
Figure 2: Population Histogram
The histogram looks normally distributed. The overall average of the 10,000 points is 100.058 and the standard deviation is 9.994, very close to the average and standard deviation used in the random number generator.
Suppose that the LSL is 60 and the USL is 140 for our process. If the average is 100 and the value of sigma is 10, then Cpk is 1.33 using the equations above. This could be considered the “true” Cpk of our population.
The Simulation
The simulation is to randomly select a given number of points from the database and then use the individuals control chart to determine the process average from the X chart and to estimate the process sigma from the moving range chart.
It should be noted that the control charts developed from random samples in the database will be in statistical control. The population (database) is not changing – it is consistent. We do not have to worry about checking for out of control points on the control charts. There may be some (rarely), but they will be false signals since the population is not changing.
To create process results and calculate the Cpk value, the following procedure was used:
- Randomly select a given number of points (50 points) from the database.
- Calculate the moving range between consecutive points.
- Calculate the overall average, the average moving range, and the control limits.
- Calculate the Cpk value using the equations above.
For more information on the calculations for the individuals control chart, please see our SPC Knowledge Base article Individuals Control Charts.
An example of the simulation for one iteration is shown below. Table 1 contains 50 points randomly selected from the population.
Table 1: 50 Random Data Points from Population
| 1 | 2 | 3 | 4 | 5 |
|---|---|---|---|---|
| 89.479 | 103.500 | 92.289 | 98.096 | 99.740 |
| 95.801 | 89.320 | 115.891 | 96.291 | 85.737 |
| 108.924 | 102.188 | 93.545 | 121.869 | 104.990 |
| 103.491 | 116.927 | 98.773 | 110.803 | 111.313 |
| 96.207 | 93.929 | 110.687 | 87.762 | 119.119 |
| 94.924 | 101.349 | 105.949 | 107.194 | 82.714 |
| 92.078 | 86.474 | 115.151 | 113.301 | 77.958 |
| 92.827 | 93.702 | 122.106 | 98.150 | 100.832 |
| 111.863 | 95.974 | 99.277 | 91.803 | 108.709 |
| 107.063 | 108.932 | 113.109 | 114.911 | 97.652 |
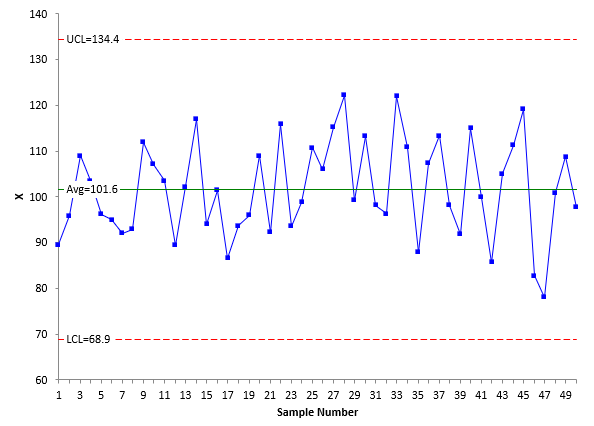
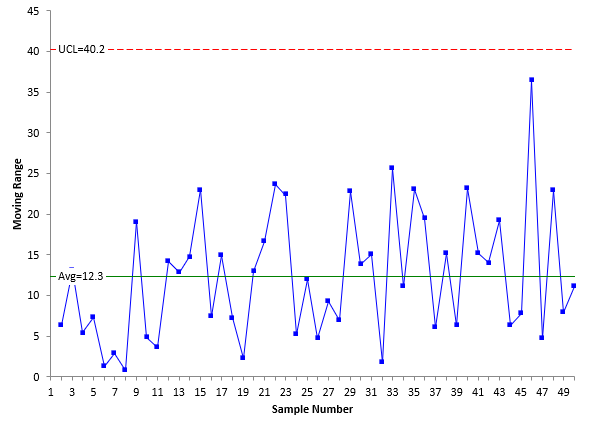
Column 1 contains data points 1 to 10, column 2, 11 to 20, etc. In this analysis, it is not necessary to make the actual X-mR charts since we know the process is in statistical control. But to confirm that, the X chart and moving range chart for the data in Table 1 are shown in Figures 3 and 4 below.
Figure 3: X Chart
Figure 4 Moving Range Chart
Both figures show the process to be in statistical control as expected. There are no points beyond the limits or patterns. For more information on interpreting a control chart, please see our SPC Knowledge Base article on Applying the Out of Control Tests. Since the process is in statistical control, the Cpk value can now be calculated. The specifications for the process are LSL = 60 and the USL = 140. The first step is to estimate the value of sigma from the average moving range on the moving range chart. The equation for this is given by:
σ=R/1.128=12.3/1.128=10.9
The 1.128 is a control chart constant for a moving range of 2. The value of Cpk can then be calculated:
Cpu=(USL –X )/3σ= (140-101.6)/(3(10.9))=1.17
Cpl= (X – LSL)/3σ=(101.6-60)/(3(10.9))=1.27
Cpk = Minimum (Cpu, Cpl) = 1.17
The simulation is then repeated over and over to see what the impact of common causes of variation is on Cpk values.
Cpk and the Simulation
The simulation is designed to show how Cpk values vary even if the process is in statistical control – only common causes of variation present. To start, the simulation was repeated 30 times and the Cpk values calculated. Of course, you don’t have this luxury in real life – you can’t repeat a production run 30 times just to calculate the Cpk values. The results from the simulation are shown in Table 2.
Table 2: Cpk Values from Simulation
| Simulation No. | Cpk | Simulation No. | Cpk | |
|---|---|---|---|---|
| 1 | 1.17 | 16 | 1.43 | |
| 2 | 1.08 | 17 | 1.07 | |
| 3 | 1.31 | 18 | 1.05 | |
| 4 | 1.56 | 19 | 1.32 | |
| 5 | 1.39 | 20 | 1.36 | |
| 6 | 1.19 | 21 | 1.11 | |
| 7 | 1.40 | 22 | 1.14 | |
| 8 | 1.32 | 23 | 1.19 | |
| 9 | 1.25 | 24 | 1.04 | |
| 10 | 1.14 | 25 | 1.20 | |
| 11 | 1.26 | 26 | 1.20 | |
| 12 | 1.39 | 27 | 1.40 | |
| 13 | 1.33 | 28 | 1.08 | |
| 14 | 1.16 | 29 | 1.39 | |
| 15 | 1.36 | 30 | 1.30 |
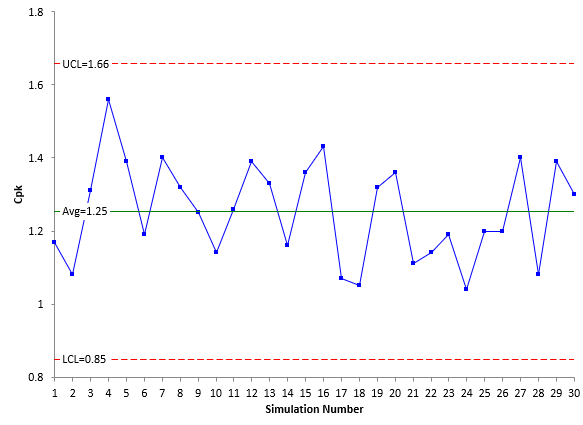
The values of Cpk vary from a minimum of 1.04 to a maximum of 1.56. This is a very large range – for a process that is in statistical control. These values of Cpk are like any production result – which means you can put them on a control chart. Figure 5 is the X chart for the Cpk values in Table 2. The moving range chart is not shown here.
Figure 5: X Chart for Cpk Values
Figure 5 is in statistical control. The Cpk values are consistent and predictable. This is not surprising since the process is in control. The average Cpk value is 1.25 but it can range from 0.85 to 1.66 (the two control limits).
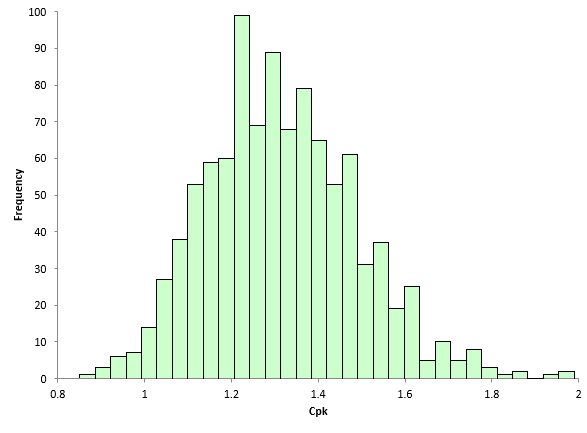
That is a lot of variation. And this is just for 30 times running the simulation. The simulation was then run 1,000 times to see the variation in Cpk values. The results are shown in Figure 6.
Figure 6: Histogram of 1000 Cpk Values from the Simulation
The average Cpk of the 1000 simulations is 1.32, close to the 1.33 from the population parameters. This is not surprising but the range of this histogram is. The Cpk value can vary from 0.85 to 1.99 when sampling the same population over time 50 times for 1000 iterations.
It would be nice to know a range of possible Cpk values when you analyze your production run. The way this is handled is through the use of confidence intervals for Cpk.
Cpk and Confidence Intervals
When you run a Cpk analysis, you calculate a Cpk value. But as seen above in the simulation, this is just an estimate of Cpk. There is uncertainty in the data. It depends on numerous things, including sample size. If we had used a sample size of 100 instead of 50, the Cpk histogram would look different. There will be less variation in the histogram as the sample size increases.
To help define that uncertainty in the results, confidence intervals are used. A confidence interval is a range of values that takes into account the uncertainty in an estimate, in this case , the Cpk estimate. 95% confidence intervals are often used. What does that 95% mean? It means if we repeated the procedure 100 times, 95 times the confidence interval would contain the true value of Cpk.
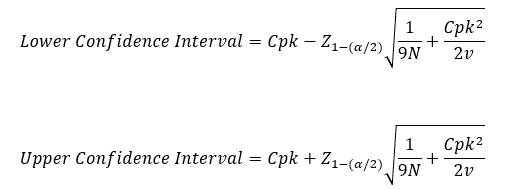
The confidence interval for Cpk is given below:
where α = 0.05 for a 95% confidence interval, Z is the standard normal distribution (use NORMSINV in Excel), N = number of samples, and v is the degrees of freedom associated with the estimate of sigma (number samples – 1 for the moving range chart).
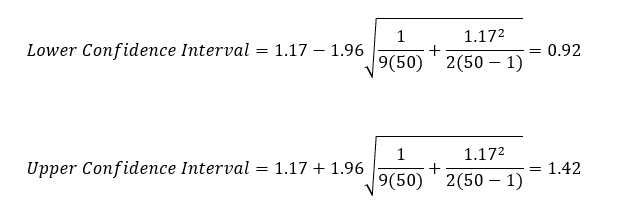
The result for the first example above with Cpk = 1.17 is then:
This confidence interval implies that the true Cpk value lies between 0.92 and 1.42 – again a fairly large range. You will see this type of confidence interval when you run a single Cpk analysis to help you understand the uncertainty in the results.
When to Recalculate Cpk
We tend to create our own problems sometimes by recalculating things too often. Recalculating Cpk values monthly is a good example of this. If a process is in statistical control, it is consistent and predictable. Once you are in control, freeze the average and the control limits. Do not recalculate anything unless the control chart gives you a reason for doing so. This also means don’t recalculate the Cpk value using different data. As long as the new data is in statistical control, nothing has changed. For more information on this, please see our SPC Knowledge Base article on When to Calculate, Lock, and Recalculate Control Limits.
Summary
This publication has looked at how Cpk values vary with just common causes of variation present. A simulation was used to allow a large number of runs to see how Cpk values vary. They vary a lot, even with a process in statistical control. Confidence intervals are used to define the uncertainty in Cpk values for a single analysis.
