August 2011
This month’s newsletter examines control limits – when to calculate them, when to “lock” them in place, and when to recalculate them. The questions posed in this newsletter are:
- How many points do I need before I can calculate control limits when I am starting a new control chart?
- When do I decide to “lock” the control limits and judge the process based on the set control limits?
- How many points have to be “in-control” before I have “good” control limits?
- How do out of control points impact the control limit calculations? Should I delete them before calculating the control limits?
- When should I recalculate the control limits?
Your answers to these questions will depend on a number of things including what you are using the control chart for and how often you take data. You may well do something different when you are collecting data hourly or daily from when you are collecting data monthly.
The answers provided below represent what I have found works over the years. Your comments are welcomed at the end of the newsletter for what has worked for you. Our March 2011 newsletter reviewed the basic purposes of a control chart and contains good background information for this newsletter. When this newsletter talks about calculating control limits, it includes the calculation of the average, upper control limit (UCL), and lower control limit (LCL). Of course, we have our Quick Links below.
How many points do I need before I can calculate control limits when I am starting a new control chart?
When I first learned control charts (a long time ago), the accepted practice was to calculate the control limits after you had 20 data points (either subgroups for an Xbar-R chart or individual samples for an X-mR (individuals) chart. You then recalculated the control limits once you had 100 individual samples. So, if you were using an Xbar-R chart with a subgroup size of 4, you would have 100 individual samples after 25 subgroups.
Back in those days, the calculations were manual – or at best with a calculator. A basic reason for waiting to do additional calculations I think. Now with computer software, the calculations are automatic and not even seen by the user. Now people talk about how many degrees of freedom the estimate of the standard deviation should have.
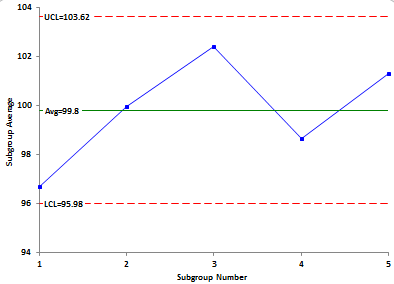
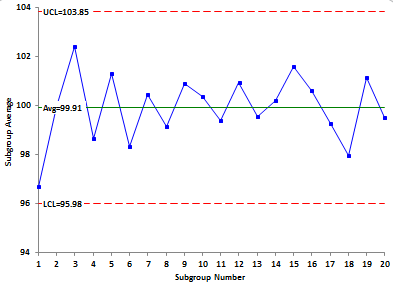
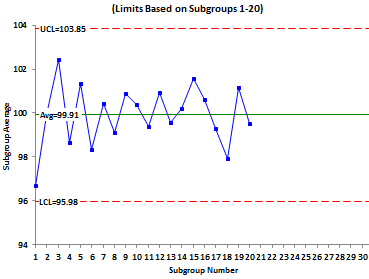
But let’s keep it simple. As a rule of thumb, you can start calculating control limits after you have 5 points. Recalculate the control limits after each point until you reach 20. Then you can “lock” these control limits for the future and use them to judge how the process is behaving. If your process is fairly stable, the control limits will not change that much from point 5 to point 20. The keywords are “fairly stable” which means that there are few, if any, out of control points present. You really don’t need to recalculate the control limits again unless you simply want to get better estimates of the average and sigma. If so, recalculate the control limits again after you have 100 individual results. The control charts below illustrate the approach.
Figure 1: Calculate Initial Limits After Five Data Points
Some data are not collected very frequently. For example, company-wide key performance indicators (see last month’s newsletter) are usually collected monthly. It will take a while to get to 20 individual results (months in this case). Many organizations want to look at year-to-year changes – even if the changes they see are just due to common causes of variation (a much too common example of leadership not understanding the information contained in variation). In these cases, you can take one year’s worth of data (12 data points) and lock the limits based on these data. These 12 data points represent your baseline data.
When do I decide to “lock” the control limits and judge the process based on the set control limits?
“Lock” means that you no longer update the control limits with each new point. You expand the “locked” control limits into the future and judge the process changes/improvements on those control limits. Lock the control limits after you 20 data points.
How many points have to be “in-control” before I have “good” control limits?
Once you start calculating control limits, your control limits are “good.” Remember, one purpose of a control chart is to identify out of control points. Your control limits do this. This question really deals with the impact of leaving out of control points in the calculations. Doesn’t that make the control limits wider? Yes. The control limits are usually wider because of the out of control points being present. But the control limits are still valid for the data.
Remember, being “in-control” is not the natural state. It takes work to bring a process into statistical control and keep it there. Using the right method to calculate control limits minimizes the impact of out of control points. In addition, the more data you have, the less impact out of control points will have on the calculations.
Should I delete the out-of-control points before calculating the control limits?
This is similar to the last question. The rule of thumb is that if you know the reason for the out of control point, then delete it from the calculations. Out of control points do have an impact on the numerical values of the control limits. How much depends on how far the point is out of control and the amount of data you have.
When should I recalculate the control limits?
Ideally, control limits should only be recalculated when you have made a process improvement – that is, you made a fundamental change to the process and it improved the process by either moving the average or reducing the variation. You know if a process change has worked because the control chart you are using will show an out of control situation after the process change.
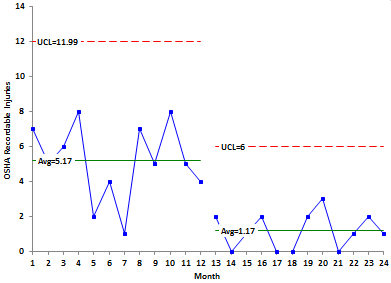
The control charts below demonstrates this. You are tracking OSHA recordable injuries per month in your plant using a c control chart. You lock your control limits based on the first 12 months. You introduce a new safety training program in month 13. You can see from the control chart that the safety training program made an impact. There is a run of points below the average – an out of control situation – proof that the new program worked.
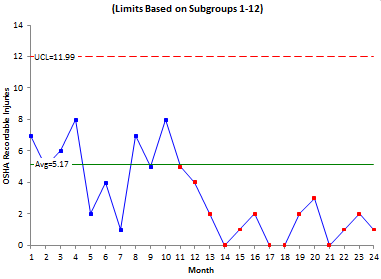
You then recalculate the control limits from the time you introduced the new program (month 13). These control limits become your new “locked” control limits. This is shown in the control chart below. This is an example of where you use the 12 month baseline data approach for monthly data.
Figure 5: Safety Program Data with Split Control Limits
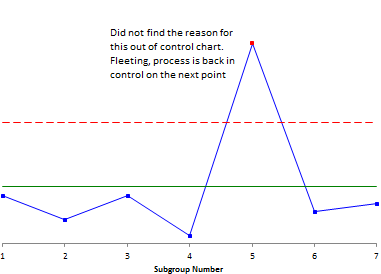
Sometimes, a control chart goes out of control and you begin to look for the special cause of variation. Suppose you have a point beyond the upper control limits as shown below. You look and look but can’t find a reason for the out of control point. The next data point comes back into control. Don’t worry about it. You missed the opportunity to find the reason for that out of control point, but it will probably be back. But this does not mean you do anything to the control limits. The one point above the upper control limit was caused by a fleeting special cause – it was there and then it was gone.
Figure 6: Control Chart with Fleeting Special Cause of Variation
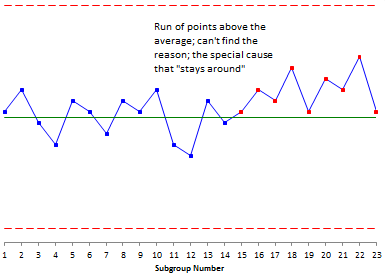
The real problem is when you can’t find the reason and the special cause stays with you – maybe you have a run above the average as shown below. The run above the average is caused by a special cause that remains – maybe something like a subtle change in a raw material. But it is still around; you just haven’t found the reason yet. You can’t find out what happened. What do you do now?
Figure 7: Control Chart with the Special Cause that Stays Around
You have a couple of options here. If the increase in average is not what you want, you may have to adjust your process to bring the average back down. That is not the “proper” thing to do but it brings the process back to where it was. If the increase in average is what you want, then recalculate the control limits from when the shift occurred and use this as the new process. In both these cases, the special cause is still around. If it goes away, the process may well reverse to where it was.
Summary
This newsletter has examined when to calculate control limits when you first start a control chart. You can start calculating the control limits after five data points. Recalculate the control limits after each data point until you have 20. Then lock the control limits and extend them into the future to judge process performance. You can delete out of control points from the calculations if you know the reason for the special cause of variation. But overall, not deleting them will have little impact on the control limits if you have sufficient data.

Best news letter on control limits Thanks
The control chart the way details are given is excellent!
Hi Sir,
I thank you very much for your letters.
Very nice article and very informative.
Just a question,how about for Xbar and R charts that are being monitored twice a day,frequency is per shift(morning and evening).how many data points is applicable before I set a control limits and when shall I recalculate.Thanks
Thanks. I think you still go with the information in the article. Start with 5 or 6 points – then recalculate each time until you have 20 points. Dont' recalculate unless there is a need to.
In this article, it was stated that if we have a run of points above the average and it is not what we want but we can't find the cause, we can change the process to bring the average down – but "this is not the right thing to do". My question is in this situation please what is the right thing to do since we can't find the cause. Overall this is a very useful article and it has been of immense help to me.Thank you very much
If you can't find the special cause, you don't have a choice but to adjust the average back down – what I meant by not the right thing to do is that you didn't find the special cause. It might go away and the process average changes again – so you will probably have more opportunities to find it. Glad you like the article. Bill
Hi Bill,Thanks a lot. The article is very nice and clear.While recalculating control limits I have encountered following situations.Request you to clrarify.9 points in row are above central line,1) I found one of them was way beyond UCL.I preferred to omit that data point while re calculating the control limits. Hope this is fine2) I found most of them beyond UCL, indicating a bigger process shift.I considered all the 9 points, for recalculating the control limits.pl confirm this is correct.3) Now there was situation,5 are within control limits and 4 are above.Not sure how to go about recalculating control limits, pl guide for below two possibillities a. Process shift happened –reason knownb. Process shift happened – reason unknown 4) Is there any rule of thumb for guidance in situation given aboveThanks a lotMurali Krishna K
The rule of thumb is that you can elminate an out of control point if you know the reason for the out of control point – what caused it to occur. In reality if you have lots of data, the out of control point will not have that big of an impact. But you can delete it if you wish – particularly if it is way beyond the control limits. I would have to see the chart to answer you other questions. Please feel free to send me the data.
This article is extremely helpful. Thanks a lot for writing this article. It answered almost all doubts I had on SPC. Remaining doubts I am writing here:1. How do we calculate 1sigma, 2sigma control limits on control chart ?2. Should we remove out of control points when special cause is analyzed & eliminated so that control limits can be recalculated?Thanks!
Thanks for the kind words.
The control limit calcluations depend on the type of control chart you are using. Please refer to the various publications in the SPC Knowledge Base for the type of control chart you are using. For example, for the individuals chart, the UCL is given by Xbar + 2.66Rbar. So, the 3 sigma limits are set at 2.66Rbar.
Yes, if you eliminate the special cause, you can elminate the point and recalculate the control limits.
Very usefull. I'm learning a lot when reading your blog. Thank you very muchIf I want to contribute money for this website, what should I do now ?
Thank you for your kind comments. We offer these articles in our SPC Knowledge Base free of charge. It is our gift to you. Of course, if you need software to help you with all these techniques, please fee free to purchase our SPC for Excel software at this link: https://www.spcforexcel.com/ordering-information
Thanks for these great articles – a real treasure trove! I have a question about recalculating the limits after each point until you have 20 points — for example, on an X-chart. Let's say you have collected 8 data points, and you have calculated limits based on that. And let's say the 9th data point is outside those limits. Do you count this as a signal of special-cause variation? I am guessing that yes, you would count that as a signal of special-cause variation. (Otherwise, what's the point of calculating the limits after each data point up to 20?) Is this correct?Thanks again! This is very helpful material, and your Excel product looks great!
Thanks for the kind comments. Yes, you would treat it as out of control point. It is a signal based on the data.
I have a question if the average control chart has been in use for over a week and you noticed that the last 6 data points have all been increasing. what should I do?
NOthing yet, there is not a single until you get 7 or more points in a row trending up. If you get that, then you should try to find the reason why the process is trending up and correct it.
Hello – Can you briefly review the pros and cons of each – fixed verus process/formula or suggest and article to read? I am also very curious on “SPC can be for checking the stability of the imbalance”. Do you have articles on sability of imbalance?
You definitely want to fix your control limits at some point and monitor versus those limits into the future. Not sure what you mean by stability of the imbalance.
hi BillVery useful article.Do you think we need to lock the Variation Chart also (Range or S chart), not just only Average Chart?Thanks
Thank you for the kind comment. Yes, you should lock both.