February 2022
(Note: all the previous SPC Knowledge Base in the variation category are listed on the right-hand side. Select this link for information on the SPC for Excel software.)

Not everybody worries about whether the process that produces the product is in statistical control. It is hard enough to get the product within specifications. Why add something else?
The reality is that you should worry about both. Yes, whether the product is within specifications, but also whether the process is in statistical control.
It is easy to see if the product is within specifications. Take a measurement and compare the result to the specifications. So simple. It takes a little more work to discover if the process producing the product is in statistical control. You must use control charts to find this out, but it is not that difficult. Take a measurement, plot the result on a control chart and interpret the control chart. Is the process in statistical control or not?
Most of the time you can’t put specification and control limits together on a control chart. However, the individuals control chart provides an opportunity to do this. This then gives you the ability to place the product and the process into one of four states depicted by Dr. Donald Wheeler: the Ideal State, the Threshold State, the Brink of Chaos, or the State of Chaos. These four states are formed by a process being in or out of control, and the product being in or out of specifications. The use of control charts is important regardless of which process state you are in.
In this publication:
- Introduction
- Statistical Control Review
- Individuals (X-mR) Control Charts Review
- The Ideal State
- The Threshold State
- The Brink of Chaos
- The State of Chaos
- Summary
- Quick Links
Please feel free to leave a comment at the end of the publication. You can download a pdf copy of this publication at this link.
Introduction
There are two dimensions that we often use in our analysis of processes:
- The product is either in or out of specifications
- The process is either in or out of control
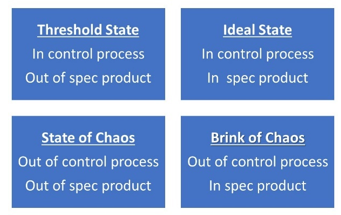
You can use the “control” and “specification” categories to create a quadrant as shown in Figure 1.
Figure 1: Four States of a Process
The quadrants were defined by Dr. Wheeler (www.spcpress.com) to be the following:
- Ideal State: the process is in statistical control and the product is within specifications
- Threshold State: the process is in statistical control and some product is out of specifications
- Brink of Chaos: the process is out of statistical control and the product is within specifications
- State of Chaos: the process is out of control and some product is out of specifications
Individuals control charts, in particular the X chart, can be used to demonstrate the state of a process. This is done below for each process state. Additional characteristics of each process state are also given. We start, however, with reviewing the concept of statistical control and what it means.
Statistical Control Review
Dr. Walter Shewhart, the father of statistical process control (SPC), divided variation in a process into two categories: controlled variation and uncontrolled variation. Controlled variation is the process variation that is described by a consistent and predictable pattern of variation. These two words – consistent and predictable – play a keep part in the four process states. He said this type of variation was due to “chance” causes. It is what we call common causes of variation.
Uncontrolled variation is described as patterns of variation that change over time unpredictably. He said these unpredictable changes were due to assignable causes, what we call special causes more often today. The control chart he developed allows us to determine the type of variation with which we are dealing. Does the process show unpredictable variation? Or does the process show predictable variation?
Why should you care what type of variation you have present? The answer is that the type of action you take to improve a process depends on the type of variation present. If your process has variation that is consistent and predictable (controlled), the only way to improve this process is to fundamentally change the process.
But, if the process has unpredictable variation, the special cause responsible for the unpredictability should be identified. If the special cause hurts the process, the reason for the special cause needs to be found and eliminated. If a special cause helps the process, the reason for the special cause should be found and incorporated into the process.
This concept of common and special causes is the foundation of the control charts Shewhart developed. A process that has consistent and predictable variation is said to be in statistical control. And it is operating at the top of its potential for the current process. A process that has unpredictable variation is said to be out of statistical control. It is not consistent and predictable. Whether or not a process is consistent or predictable (in statistical control) is one key in understanding the four process states.
Individuals (X-mR) Control Chart Review
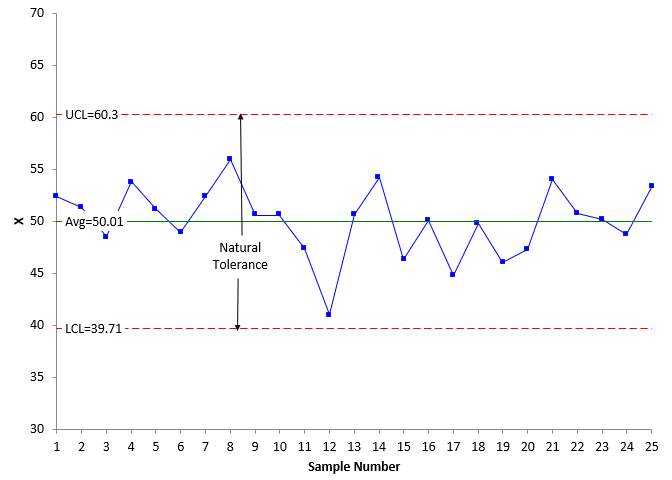
The only way to effectively determine if a process is in statistical control is through the use of control charts. The individuals control chart is used below to give examples of the four process states. An individuals control chart is really two charts. One chart is used to monitor the individual results – the X values. The other chart is used to monitor the moving range between consecutive values – the mR values. For this analysis, only the X chart will be used. An example of an X chart is shown in Figure 2. You may download the data used in all the examples in this publication at this link. All the charts were made using the SPC for Excel software.
Figure 2: X Chart Example
Each individual value is plotted on the X chart. In the figure above, the first two results are 52.4 and 51.3. These are plotted as well as the rest of the 25 results. The average X value (the process average) and control limits are calculated and added to the charts. The process average in this example is 50.01. The upper control limit (UCL) is 60.30 and the lower control limit (LCL) is 39.71. The UCL represents the largest value you would expect if you only have common causes of variation present. The LCL represents the smallest value you would expect if you only have common causes of variation present.
With the individuals chart, the difference between the UCL and LCL is called the Natural Tolerance. It represents the range the process requires to operate with only common causes of variation present. Since the control limits are based on +/- three sigma (s), the Natural Tolerance is given by:
Natural Tolerance = 6s
Remember, if a process is in statistical control, it is consistent and predictable and is operating at the highest level possible for the current process. The process in Figure 2 is in statistical control. There are no points beyond the control limits and there are no patterns (e.g., a run of 8 above the average). This process is consistent and predictable.
The Ideal State
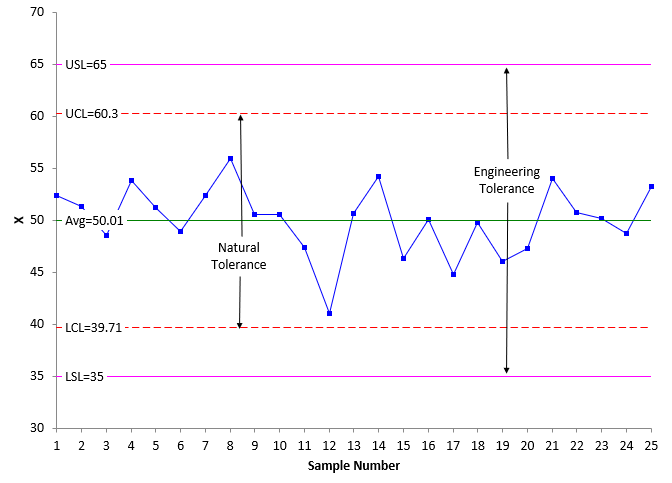
One nice thing about the individuals control chart is that you can add the specifications to the X chart. You can’t do that with many control charts, such as the subgroup averages (?) chart. Suppose the specifications for the product are a lower specification limit (LSL) = 35 and an upper specification limit (USL) = 65. These have been added to the data in Figure 3. Figure 3 is an example of a process and product in the Ideal State.
Figure 3: Ideal State
In the Ideal State, the process is in statistical control (i.e., it is consistent and predictable – all points within the control limits and no patterns) and all the product is within specifications (all the points are between the LSL and the USL).
The difference between the LSL and the USL is called the Engineering Tolerance:
Engineering Tolerance = USL – LSL
In the Ideal State, the Engineering Tolerance is greater than the Natural Tolerance. And since the process is in statistical control, the product will remain within specifications as long as the process remains the same.
In addition to the process being in control and the Natural Tolerance being less than the Engineering Tolerance, Dr. Wheeler added two more conditions for the process to operate in the Ideal State:
- The process must be operated in a consistent manner, i.e., no changing of operating conditions arbitrarily
- The process average (X) must be set at the proper level
Control charts are important in the Ideal State. They provide the method of ensuring that the four conditions are met over time. The process will continue to be consistent and predictable, and the product will be within specifications as long as the process stays the same.
The Threshold State
In the Threshold State, the process is in statistical control but there is product that is out of specifications. And since the process is consistent and predictable, out of specifications product will continue to be made until the process is fundamentally changed. The process is doing the best it can for the current process. In these situations, sorting is often used as a method to separate the “good” from the “bad” product. But seldom does 100% sorting catch all the product that is out of specifications.
There are three situations that can create the Threshold State:
- The process average is too high
- The process average is too low
- The Natural Tolerance in the process is greater than the Engineering Tolerance
Figure 4 is an example of the process average being too high.
Figure 4: Threshold State with the Process Average Too High
The points are all with in the control limits. The Engineering Tolerance is greater than the Natural Tolerance, but the problem is that the process average is well above the center point of the specifications. This leads to the control limit (UCL) being outside the specification (USL). Product above the USL is being produced. Again, since the process is consistent and predictable, out of specifications product will be made until the process is fundamentally changed.
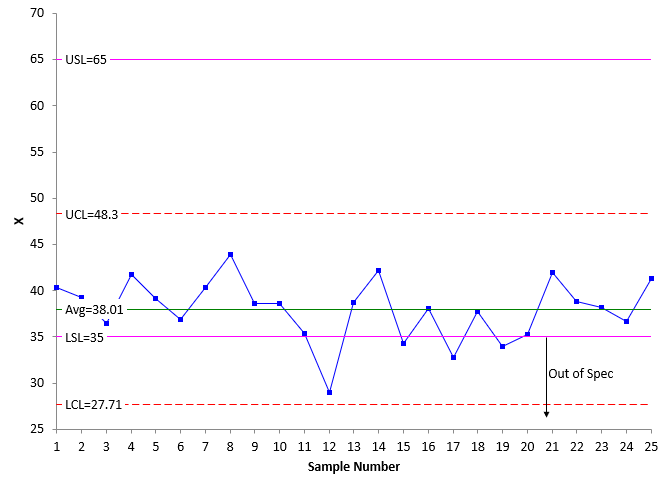
Figure 5 is also an example of the Threshold State but this time the process average is below the center of the specifications.
Figure 5: Threshold State with the Process Average Too Low
Again, the process is consistent and predictable, and the Natural Tolerance is less than the Engineering Tolerance. However, the process average is too low and the LCL is below the LSL – leading to out of specifications product. Again, since the process is consistent and predictable, out of specification product will be made until the process is fundamentally changed.
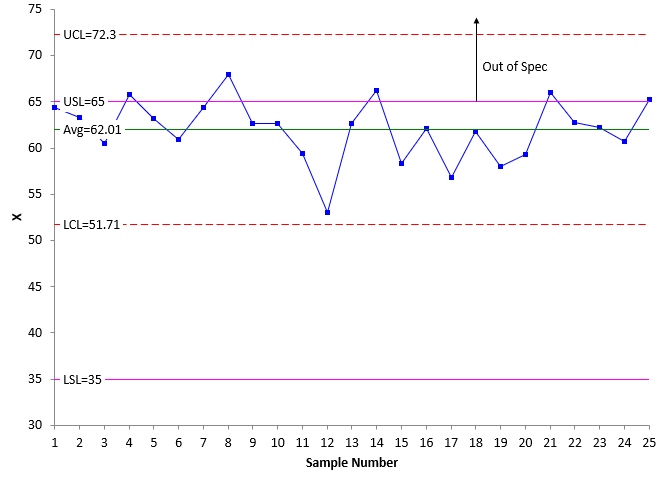
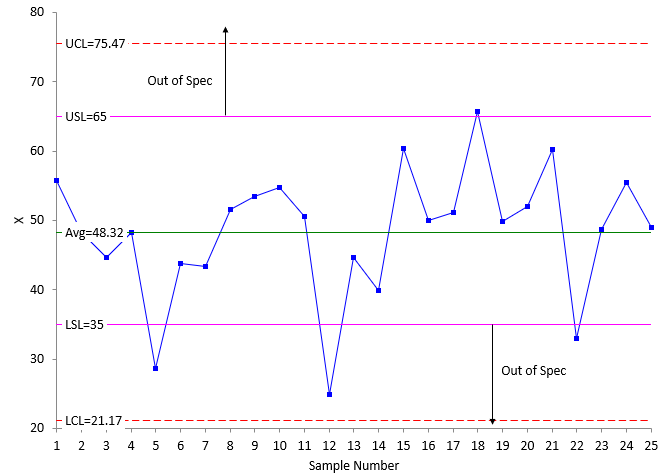
Figure 6 is an example of the Threshold State where the Natural Tolerance is no longer smaller than the Engineering Tolerance. The process has too much variation to fit between the specification limits.
Figure 6: Threshold State with Too Much Process Variation
The process is consistent and predictable – all the points are within the control limits and no patterns. In this case, the specifications are within the control limits meaning there is product that is out of specification. Again, since the process is consistent and predictable, out of specification product will be made until the process is fundamentally changed.
Control charts are very important in the Threshold State. To move to the Ideal State, the process average must be moved higher or lower or the process variation must be reduced. Which is easier to do? Moving the average is usually easier. The control chart will show the impact of the process changes that you make – and you must make fundamental process changes to improve a process that is in statistical control.
The Brink of Chaos
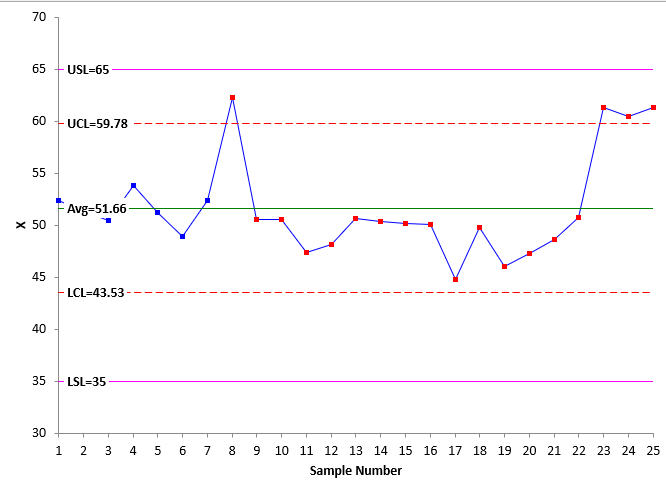
The Brink of Chaos State exists when the process is not consistent and predictable, but all the product is within specifications. Figure 7 is an example of the Brink of Chaos.
Figure 7: Brink of Chaos
The process is not in statistical control. There are points beyond the UCL and a run below the average – both signals of special causes being present. However, all the product is within the specifications. The Brink of Chaos is a tough position to be in. After all, the product is all good. What is there to worry about? Unfortunately, too many of us don’t worry about it, and it leads eventually to out of specification product.
You should worry when the process is not consistent and predictable. You don’t know what is going to happen in the future. With special causes coming and going and no effort to remove them, the process will most likely continue to be unpredictable and out of specifications product will be produced eventually.
Control charts are important during the Brink of Chaos as well. To get out of this state, you must bring the process into statistical control. The first step in doing this is to discover that the special cause is present. A control chart is the only way to do that effectively. Then find out what is causing it and eliminate it from the process. Again, a control chart will tell you if you were successful.
The State of Chaos
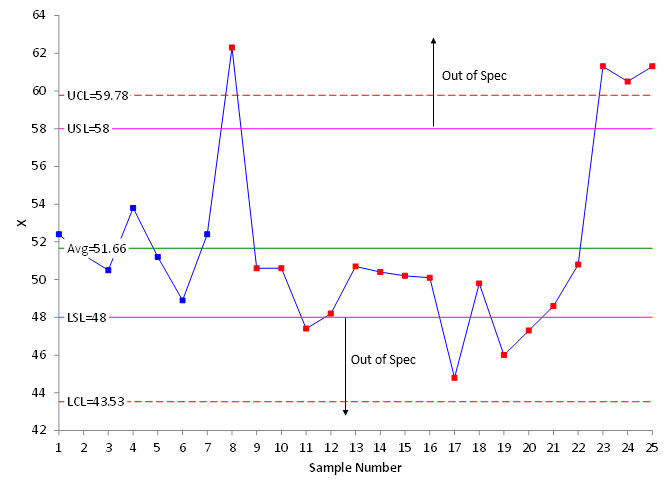
The State of Chaos occurs when the process is not consistent and predictable and out of specification product is being produced. Figure 8 is an example of the State of Chaos.
Figure 8: State of Chaos
In this example, there are points beyond the control limits and patterns present so the process is not consistent and predictable. In addition, the Natural Tolerance is greater than the Engineering Tolerance so out of specification product is being produced. You have no idea what is going to happen in the future. It is a mess.
Again, control charts are essential to try to move out this process state. Like with the Brink of Chaos, the special causes of variation need to be found and eliminated. The only way to effectively do this is through the use of control charts. Eventually, you will have to address how to reduce the Natural Tolerance.
Summary
This publication has examined the four process states developed by Dr. Wheeler. The quadrant is divided by whether the process is in statistical control or not and whether there is any product that is out of specification or not. The four states are:
- Ideal State: the process is in statistical control and the product is within specifications
- Threshold State: the process is in statistical control and some product is out of specifications
- Brink of Chaos: the process is out of statistical control and the product is within specifications
- State of Chaos: the process is out of control and some product is out of specifications
The use of control chart is important in each process state, whether it be maintaining a process in statistical control or finding and removing special causes of variation.
Thank you for the publication. its very informative
A very good article, however, I have a couple of observations (as I would like to discuss this with my Continuous Improvement Team.Firstly, it would hav been good for the graphs to have shown the spcification target and limits (50+-15). It would help those learning about SPC control to easily see the process position.Secondly, Figure 6 where process variation is greater than engineering tolerence. To me if the natural tolerance is greater than allowable for the engineering tolerance then it belongs to State of Chaos as the process is incapable of meeting specification and requires improvement to return to a lower status.Finally, software is very good and I use it regularly.Keep up your good work
Hi Pat. Thanks for the kind comments. Figure 6 – it is in statistical control so even if there is out of spec product, you can predict what will happen – not the case for Chaos where the process is out of statistical control.
Thanks
Thank you so much for this article. It contains a lot of useful information