April 2023
First 3 Months Of 2023 Generated a Record Number of Tornadoes
And then this statement:
“The NWS recently updated the number of preliminary tornadoes in the country since the year began, putting the number at 466. The preliminary figure is a record-high tornado count through the first three months of the year since record-keeping began in 1950. As storm data is finalized, the count may change.”
The statement is true – the most tornadoes in the first three months of the year, according to the National Weather Service (NWS). Does this mean that the tornado frequency is increasing? Maybe, but maybe not. What about the intensity of tornadoes? Are they getting more severe? Is global warming affecting the frequency or intensity of tornadoes?
You must look at the data over time to answer these questions. One data point really does not tell us anything. And, of course, the best way to look at data over time is usually with a control chart. In this publication:
- Background Information on Tornadoes
- The Data
- Data to Include in the Analysis
- Average Number of Tornadoes per Month
- First Quarter of 2023 Tornadic Activity
- Are Tornadoes Getting Stronger?
- Is Global Warming Causing More or Stronger Tornadoes?
- Summary
- Quick Links
Please feel free to leave a comment at the end of the publication. You may download a pdf copy at this link.
Background Information on Tornadoes
There are about 1200 tornadoes on average each year in the United States. A tornado is a violently rotating column of air that extends from the base of a cloud to the ground. This rotating thunderstorm is called a supercell. It is usually accompanied by heavy winds, lightning, and hail.
The tornado is characterized by its funnel-shaped appearance. Tornadoes can cause significant damage to structures and can be deadly, with wind speeds that can exceed 200 miles per hour.
Tornadoes are most common in the United States, particularly in a region known as Tornado Alley. This region includes parts of Texas, Oklahoma, Kansas, Nebraska, South Dakota, and Iowa. However, tornadoes can occur in other parts of the world as well.
Tornadoes vary in size and intensity. The strength of a tornado is currently measured using the Enhanced Fujita (EF) scale, which was introduced in 2007. This scale is based on the damage caused by the tornado. The scale runs from EF0 to EF5. EF5 is the most destructive. This scale takes into account, not only the estimated wind speeds, but also assigns a rating based on the damage caused. A summary of the scale is given in Table 1.
Table 1: Enhanced Fujita Scale Overview
| Scale | Wind Speed (MPH) | Damage |
|---|---|---|
| EF0 | 65-85 | Minor |
| EF1 | 86-110 | Moderate |
| EF2 | 111-135 | Considerable |
| EF3 | 136-165 | Severe |
| EF4 | 166-200 | Devastating |
| EF5 | >200 | Incredible |
The NWS uses trained meteorologists to survey the damage path of the tornado and determine the EF rating based on the damage. Meteorologists use specific examples to determine the type of damage. The original Fujita Scale was introduced in 1971. It had slightly different wind speeds and criteria than the current enhanced scale. See this link for a history of the two scales.
The Data
Tornadoes have been documented over the years, but it is only since 1950 that a “modern” database has been kept. And the early portions of that database are probably suspect. The tornado database has improved significantly over time due to advances in technology and improved data collection and analysis methods. Back in the 1950’s many things were done by hand. It was difficult to capture all tornadoes with that system. But slowly over time with the aid of computers, satellites and radar, data collection on tornadoes has improved significantly. The data used in this analysis comes from two sources:
- National Center for Environmental Information (part of the National Oceanic and Atmospheric Administration)
- Wikipedia
The first link contains data on the frequency of tornadoes as well as the number of fatalities per month since 1950. The second link contains the data for the severity ratings based on the Fujita Scale prior to 2007 and the Enhanced Fujita Scale after that. These data reflect tornadoes in the United States.
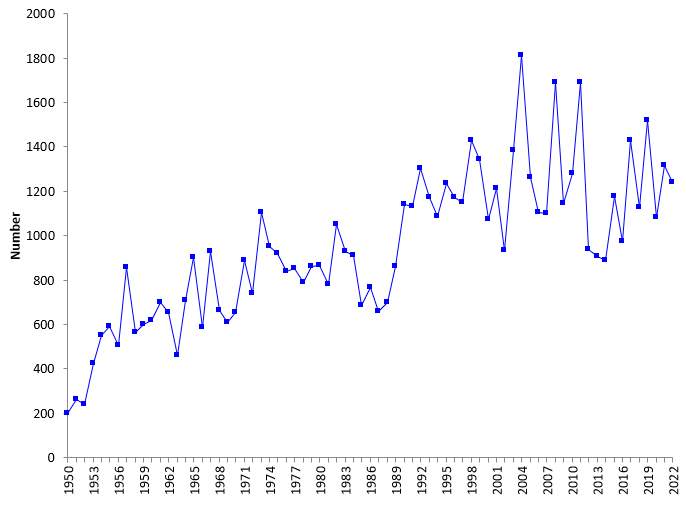
So, what does the raw data look like? You can download the data used in this analysis at this link. Figure 1 shows the data for the number of tornadoes per year.
Figure 1: Number of Tornadoes per Year (1950 – 2022)
You can see in Figure 1 that the number of tornadoes has increased since 1950. Part of that increase in the first half of the chart is probably due to better collection of tornadic data. The second half of the chart looks somewhat stable. There is no upward or downward trend.
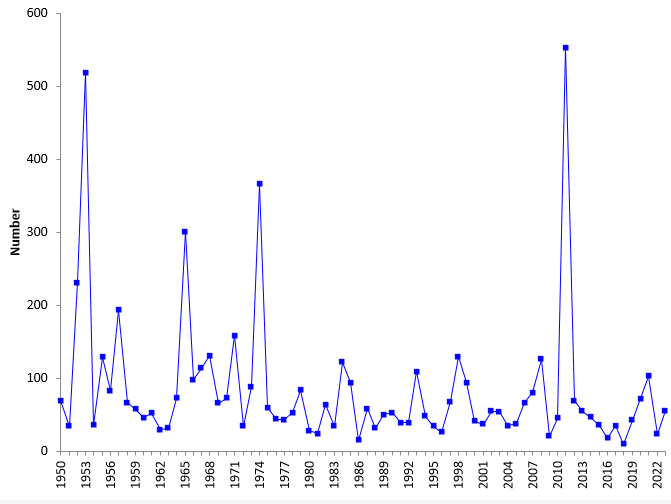
Figure 2 shows the number of deaths due to tornadoes each year.
Figure 2: Number of Deaths per Year from Tornadoes (1950- 2022)
There have definitely been some years with significantly higher death totals from tornadoes. But, it is interesting to note, that the number of deaths has not increased over time as the number of tornadoes have. This is no doubt due to the fact that deaths occurred in stronger tornadoes, and these were easily counted in the earlier part of the database. The increase in number of tornadoes over time is most likely due to counting more of the smaller tornadoes that occur.
Data to Include in the Analysis
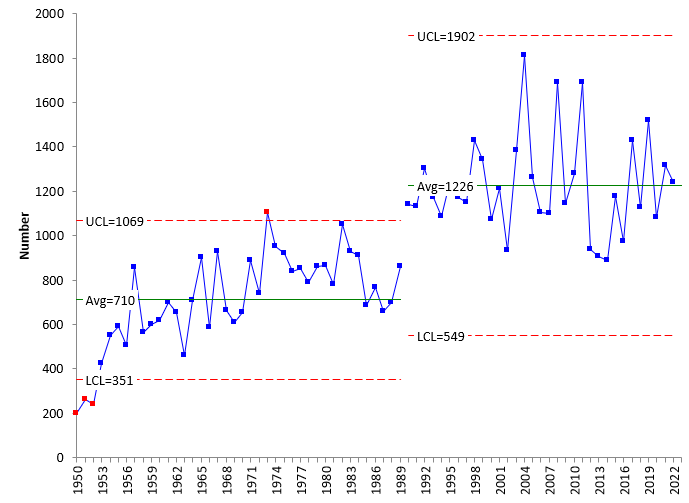
To analyze if the increase in tornadoes in the first three months of 2023 is significant, we need to establish a baseline data period. Looking at Figure 1, you can see that the number of tornadoes reported increases from 1950 through 1989. From 1990 through 2022, the data seems to be stable. This marks a potential point to set the baseline data. The data in Figure 1 were re-analyzed using an individuals (X-mR) control chart. Only the X chart is shown below.
Figure 3: X Chart for Number of Tornadoes with Split Control Limits (1950 – 2022)
The average and control limit are split at 1990. The first part of the chart may have another stable period, but for our purposes here, it appears we can use the time period from 1990 – 2022 as the baseline data for tornadoes. During this time period, the average number of tornadoes was 1226. The control limits, which define the normal variation in the process, are 549 to 1902. This means, if the process stays the same, we can expect from 549 to 1902 tornadoes each year.
The analysis below will only use the baseline data from 1990 to 2022.
Average Number of Tornadoes per Month
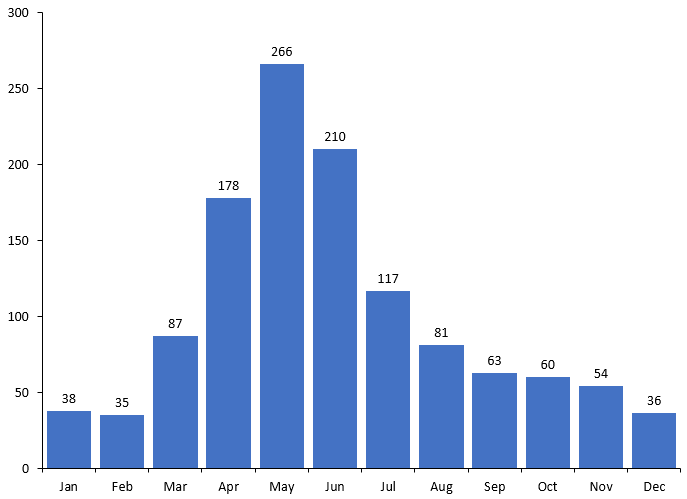
The monthly average tornadic activity is shown in Figure 4.
Figure 4: Average Number of Tornadoes per Month (1990 – 2022)
The three busiest months of the year are April, May, and June. The winter months of December, January and February are the slowest months in terms of tornadic activity.
First Quarter of 2023 Tornadic Activity
Let’s return to the first quarter of 2023 that was mentioned at the start of this article. During that quarter there were 466 tornadoes. The number each month were:
- January 2023: 168 compared with the average of 38 per month from 1990 to 2022
- February 2023: 55 compared with the average of 35 per month from 1990 to 2022
- March 2023: 243 compared with the average of 87 per month from 1990 to 2022
The number each month is much higher than the month’s baseline average. But does this mean there is a special cause of variation present? That the result is statistically different from the past? You need a method of determining this and, again, we return to the control chart.
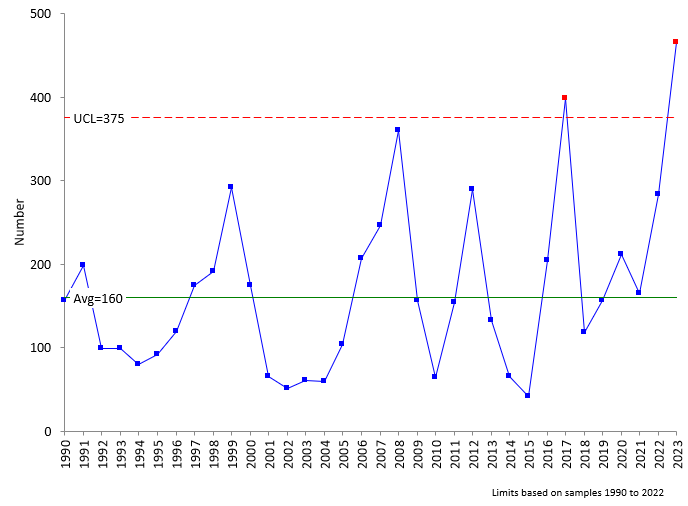
There are two options you can use for a control chart here: one for each month for a total of 3 control charts or one for the whole first quarter. It is usually best to tunnel down to the individual months. However, since the article discussed the first quarter, we will examine the data for the first quarter together. Figure 5 shows the number of tornadoes for the first quarter since 1990.
Figure 5: First Quarter Tornadic Activity (1990 – 2022)
The first quarter in 2023 is significantly different than the data from 1990 – 2022. There is one other out of control point on the chart from 2017. So, the news reports are correct. The first three months of 2023 are significantly different than previous years.
But, what does this mean? Does it mean then that the number of tornadoes will continue to be this high? Or is it a fleeting out of control point like 2017? We don’t know until more data comes in for the year. But if you look at the data per month you will find some out of control points occasionally. But they all went away in the next month.
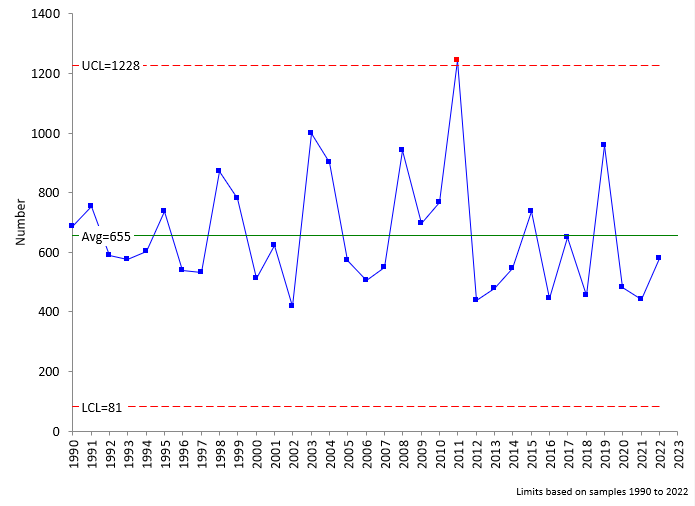
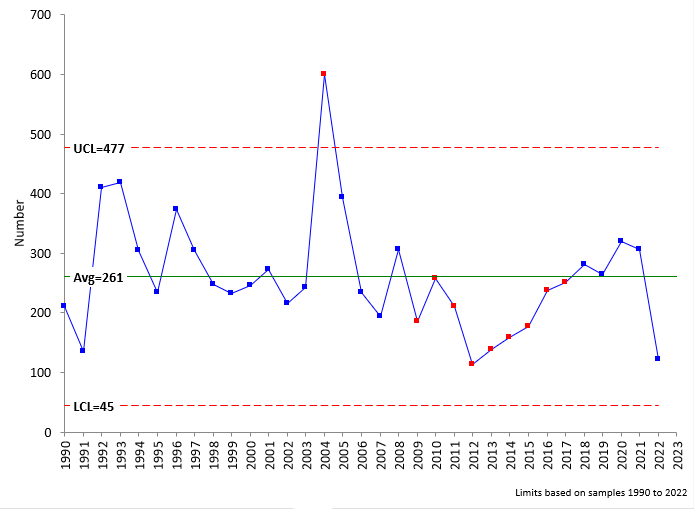
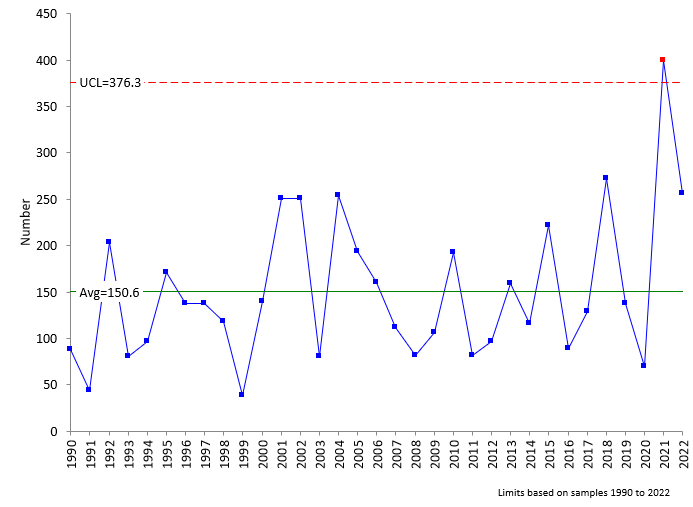
Figures 6 – 8 show the control charts for the second, third and fourth quarters respectively through 2022.
Figure 6: Second Quarter Tornadic Activity (1990 – 2022)
Figure 7: Third Quarter Tornadic Activity (1990 – 2022)
Figure 8: Fourth Quarter Tornadic Activity (1990 – 2022)
The data for these quarters during 2023 will confirm if there is an increase in tornadic activity. Based on history, it does not appear that this is the case.
You can download the number of tornadoes by month at this link. This will give you additional insights into the data.
Are Tornadoes Getting Stronger?
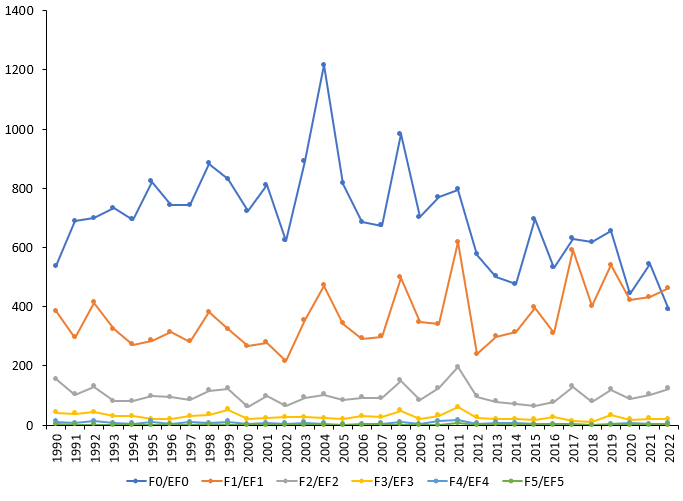
This question has been asked lately, particularly with global warming. So, how do you answer this question? Again, charting is key. Figure 9 is a plot of the tornado intensities from 1990 to 2022.
Figure 9: Tornado Intensities (1990 to 2022)
This chart uses the Fujita Scale from 1990 – 2006 and then the Enhanced Fujita Scale from 2007 on. This will cause some minor differences, but the overall trends are still valid. Based on this chart, it does not appear that tornadoes are intensifying in recent years. It does look like the number of EFO tornadoes is decreasing while the number of EF1 tornadoes is increasing. Control charts can confirm that.
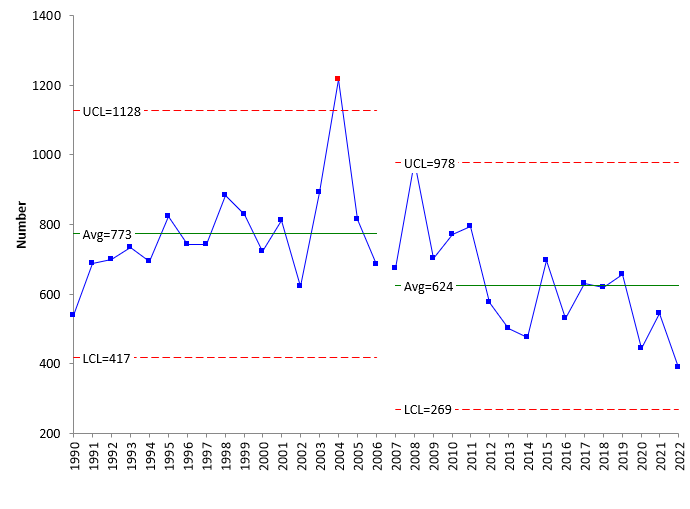
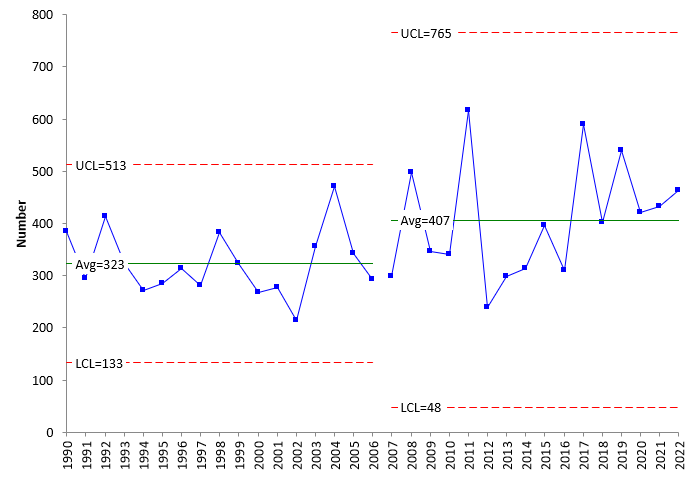
Figure 10 is a control chart for the number of EF0 tornadoes per year and Figure 11 is the same for EF1 tornadoes. The control limits are split in 2007 when the EF scale was introduced.
Figure 10: Number of EF0 Tornadoes per Year (1990 – 2022)
Figure 11: Number of EF1 Tornadoes per Year (1990 – 2022)
The control charts confirm that the number of EF0 tornadoes appears to be decreasing as the number of EF1 tornadoes appears to be increasing. So, there may be more of the more intense EF1 tornadoes than the less intense EF0 tornadoes. But what about the really intense tornadoes that cause most of the deaths and damage?
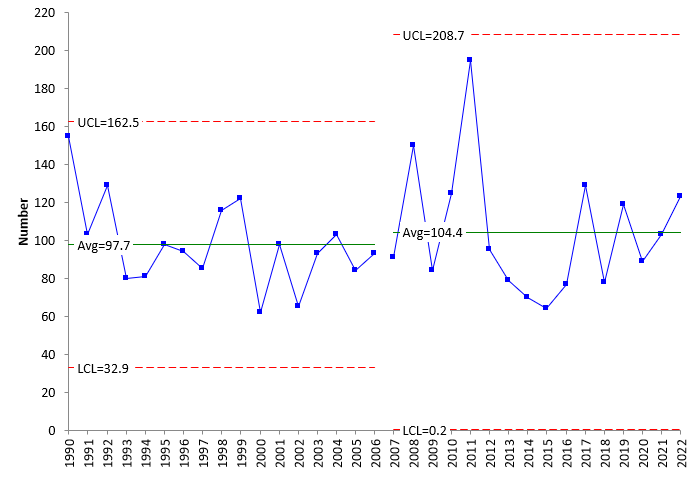
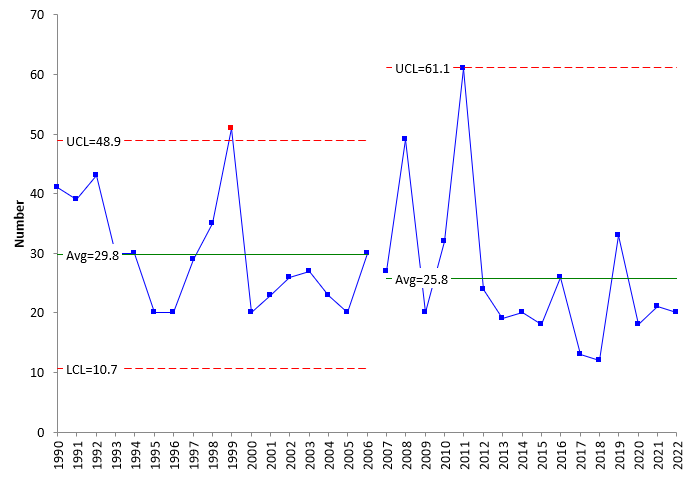
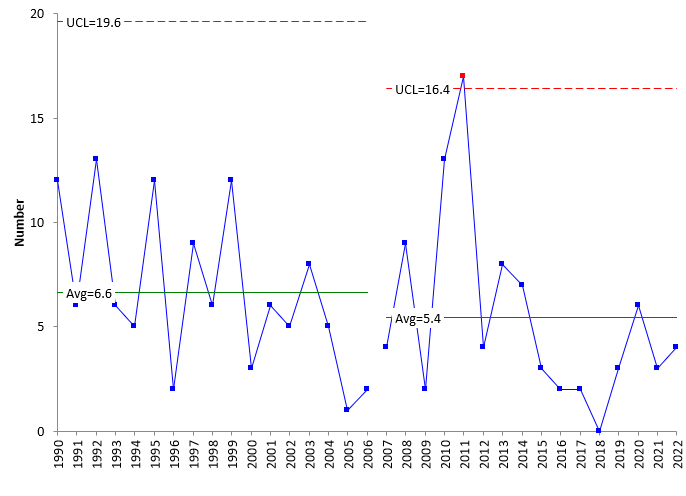
Figures 12 – 14 show the control charts for EF2, EF3 and EF4 tornadoes. What do these control charts tell you about the number of tornadoes with higher intensity?
Figure 12: Number of EF2 Tornadoes per Year (1990 – 2022)
Figure 13: Number of EF3 Tornadoes per Year (1990 – 2022)
Figure 14: Number of EF4 Tornadoes per Year (1990 – 2022)
The control charts show that the number of EF2 tornadoes per year is staying about the same, while the number of EF3 and E4 tornadoes appears to be decreasing in the last 10 years or so.
There have been very few EF5 tornadoes since 1990, averaging 0.6 per year. There has not been one since 2013, the longest streak since the modern record has been kept.
So, are tornadoes getting stronger in recent years? No, they are not. In fact, the data shows there have, on average, been less EF3, EF4 and EF5 tornadoes in recent years.
Is Global Warming Causing More or Stronger Tornadoes?
We have looked at global warming multiple times in our publications. You can see our last publication on global warming at this link. The data has consistently shown that the earth is getting warmer – an upward trend. If global warming was causing more tornadoes or stronger tornadoes, we would expect to see upward trends in the charts. Figure 3 shows the number of tornadoes per year. There has been no upward trend since 1990. Global warming is not causing more tornadoes. The data in the last section showed that the intensity of tornadoes does not appear to be increasing. So, global does not appear to be causing more intense tornadoes.
Does this mean that global warming is not impacting the formation of tornadoes? Not necessarily, but not based on what we can measure on the frequency or intensity at this point. It may be that as the colder months get warmer, more tornadoes are produced, like in Quarter 1. But this does not appear to apply to other quarters.
Summary
This publication examined the data on tornadoes. The first three months of 2023 saw a record number of tornadoes. Was this point truly significantly different? Yes, it was, based on a control chart analysis. Will the high number of tornadoes continue? Probably not. History shows that out of control points for tornadic activity are usually followed with values back in the normal range. So, until we have more data, it does not appear that the number of tornadoes is increasing significantly. Nor is the intensity of the tornadoes.
