March 2015

I was at the doctor’s office in January of this year. A new doctor for me. The nurse took my blood pressure. It was 141/88. She said that was a little high and asked if I normally had blood pressure this high. In the past, I have usually been in the 120/70 range. But I am getting older. When I saw the doctor, she said that I needed to check my blood pressure at home for a while to see if it stays that high. And if so, come back to see her.
So, I needed to take measurements over time. What a great practical application and opportunity to use statistical process control. What is the variation in my blood pressure? Is it consistent and predictable? Has it increased? Are there special causes present? Great everyday application for using control charts. So, this month we will take a look at how you can use control charts to monitor blood pressure readings – using my blood pressure readings over a two month period.
In this issue:
You can download a pdf copy of this publication can be downloaded here.
Blood Pressure Overview
Since I have always had a “good” blood pressure, I really didn’t know when blood pressure became too high. So, I did some investigating on the web. Internet can’t be wrong.
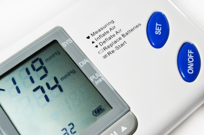
My 141/88 does appear high. Yet, according to the website heart.org,
“A single high reading does not necessarily mean that you have high blood pressure. However, if readings stay at 140/90 mm Hg or above (systolic 140 or above OR diastolic 90 or above) over time, your doctor will likely want you to begin a treatment program.”
A single point in time means essentially nothing. You have to be able to compare it to past history. Is a high reading “normal” – you need treatment – or is it just due to a special cause? Only good way to find out if my blood pressure stays above 140 and 90 is to chart the data over time. Perfect application of a control chart, don’t you think?
The Mayo Clinic website divides blood pressure readings into four categories as shown in the table below.
Table 1: Blood Pressure Categories
| Top number (systolic) | Bottom number (diastolic) | Your Category |
|---|---|---|
| Below 120 | and Below 80 | Normal blood pressure |
| Between 120-139 | or Between 80-89 | Prehypertension |
| Between 140-159 | or Between 90-99 | Stage 1 hypertension |
| 160 or higher | or 100 or higher | Stage 2 hypertension |

The website says if you are in the normal or prehypertension category, you should “maintain or adopt a healthy lifestyle.” I guess that means exercise, weight control and the proper diet. If you are in Stage 1 hypertension, you should maintain or adopt a healthy lifestyle and, if your blood pressure is not down within a month, you should contact your doctor about taking medications to help reduce your blood pressure. If you are in Stage 2 hypertension, you need to go see your doctor about getting on medication – and, of course, maintain or adopt a healthy lifestyle.
Measuring Blood Pressure

You can also purchase blood measure measuring devices for use at home. I purchased one a few years ago, from HEB grocery store, called “In Control”. Got to love that name when you think about control charts. Anyway, this is the device I used to measure my blood pressure over the past couple of months.
How Repeatable is Measuring Blood Pressure?
How repeatable is this “in Control” blood pressure measuring device? Of course, this is something we always should be concerned about. How repeatable is our measurement system? To take a quick look at this, I simply took my blood pressure five times in a row. The results are shown in Table 2. (Note: you probably need to do this more than five times to get a better estimate, but my arm got tired of getting squeezed by that cuff).
Table 2: Blood Pressure Measurement Repeatability
| Trial | Top Number (Systolic) | Bottom Number (Diastolic) |
| 1 | 129 | 79 |
| 2 | 133 | 75 |
| 3 | 129 | 85 |
| 4 | 128 | 80 |
| 5 | 129 | 83 |
| Average | 129.6 | 80.4 |
| Est. Sigma | 2.2 | 4.9 |
The top number seems pretty predicable. The average for the five systolic readings was 129.6. The average moving range between consecutive samples was 2.5. As shown in our December 2014 newsletter on evaluating the measurement process, we can use this average moving to estimate the measurement system variability. The equation below gives the estimate of the measurement variance.
σe2= (mR/1.128)2= (2.5/1.128)2= (2.2)2=4.8
So, the variance for the systolic blood pressure measurement is 4.8.
Now, look at bottom number for the diastolic blood pressure. A little surprised at the variation in the bottom number? The average was 80.4. The average moving range was 5.5 –more than twice the average moving range of the top number. The variance for the bottom number is:
σe2= (mR/1.128)2= (5.5/1.128)2= (4.9)2=24.0
We will use these variances to determine the % of variance due to the measurement system below (as described in that December 2014 newsletter).
The Results
I took my blood pressure readings at random times over a two month period. According to information from those websites, you should take your blood pressure reading at the same time each day and when you are relaxed. I didn’t take it at the same time, just whenever I thought about it. And not every day. But I made sure that I was relaxed – hadn’t just exercised – or just drank coffee – they say caffeine causes your blood pressure to increase.
The “in Control” device had a memory that stores the results. It turns out that there four readings I took back in 2014. These four readings provided me the baseline data. The results are shown in table 3.
Table 3: Blood Pressure Readings
| Date | Top Number (Systolic) | Bottom Number (Diastolic) |
| 4/25/2014 | 127 | 66 |
| 9/3/2014 | 126 | 69 |
| 9/3/2014 | 130 | 77 |
| 10/5/2014 | 125 | 65 |
| 2/15/2015 | 142 | 89 |
| 2/16/2015 | 125 | 89 |
| 2/16/2015 | 131 | 79 |
| 2/18/2015 | 141 | 77 |
| 2/19/2015 | 134 | 76 |
| 2/19/2015 | 122 | 92 |
| 2/23/2015 | 148 | 89 |
| 2/24/2015 | 130 | 92 |
| 2/25/2015 | 144 | 88 |
| 2/26/2015 | 136 | 95 |
| 2/27/2015 | 157 | 100 |
| 3/6/2015 | 137 | 80 |
| 3/8/2015 | 152 | 76 |
| 3/9/2015 | 145 | 98 |
| 3/16/2015 | 133 | 79 |
| 3/19/2015 | 131 | 79 |
| 3/20/2015 | 129 | 77 |
| 3/24/2015 | 142 | 82 |
| 3/30/2015 | 136 | 86 |
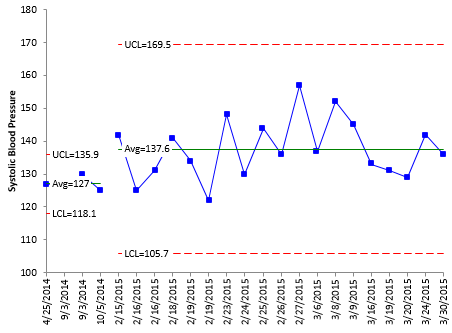
The next step is to construct a control chart of the results. Since these are individual readings, we will use the individuals (X-mR) control chart. For information on how to construct and interpret this chart, please see our newsletter on individuals control charts.

Figure 1: Systolic Blood Pressure Results
Remember what the control limits do. They separate common causes of variation – the normal variation in your process – from special causes – things that are not supposed to be there. Common causes of variation is consistent and predictable. As long as the data are within the control limits and there are no patterns, the process is said to be in statistical control. It is consistent and predictable.

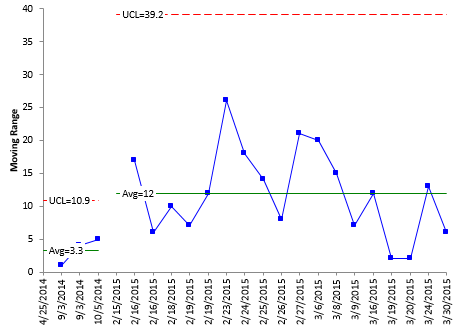
Figure 2 plots the moving range between consecutive points. For example, the first moving range is the range between the first two blood pressure readings: |127 – 126| = 1. The moving range chart is in statistical control as well. This means that the short-term variation – the range between consecutive blood pressure readings – is consistent. On average, the systolic blood pressure reading will vary by 12 each day. Some days it can be 39 above or below the previous reading.
Figure 2: Systolic Blood Pressure Moving Range Results
Just like before, we can estimate the standard deviation from the average moving range on the chart. The average moving range is 12. So, the estimated standard deviation is found by dividing this average moving range by 1.128 (as we did before). The estimated standard deviation is 10.6 for the variation in my blood pressure over time.
We can compare this value to the measurement system variance calculated above (4.8 for the systolic measurement system). The % of variance due to the measurement system is the ratio of that variance to the variance from my blood pressure “process” – which is (10.6)2 = 112.4
% of variance due to the systolic blood pressure measurement = 4.8/112.4 = 4.2%
The measurement system for the systolic blood pressure seems quite good.
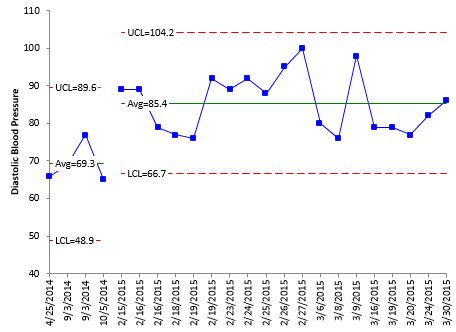
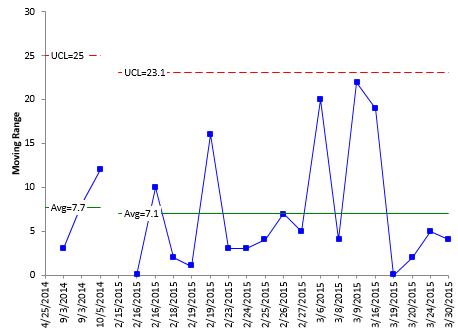
The diastolic blood pressure results are shown in Figures 3 (X chart) and 4 (moving range chart).
Figure 3: Diastolic Blood Pressure Results
Figure 4: Diastolic Blood Pressure Moving Range Results

The estimated standard deviation from the moving range chart for the diastolic blood pressure is 6.3. So, the variance for my blood pressure process is 39.69. We can now compare that to the measurement system variance.
% of variance due to the diastolic blood pressure measurement = 24/39.69 = 60%
The diastolic blood pressure measurement system contributes a lot to the variation – much more than the 4% due to the systolic result. I don’t know if this is typical – or just the case that I only measured my blood pressure five times in a row. But it seems to be a big difference from the result for the systolic measurement system variance.
Conclusions
- My systolic blood pressure has increased from what it was in the past based on the four baseline samples and the fact that I always remember that blood pressure being around 120; the “new” average for my systolic blood pressure is 137.
- My diastolic blood pressure has also increased from what it was in the past based on the four baseline readings and the fact I always remember that blood pressure being around 70; the “new” average for my diastolic blood pressure is 85.
- My blood pressure varies a lot more than I thought it would, but that variation appears to be consistent and predictable (in control)
- Based on these readings, my blood pressure falls in the prehypertension category listed by the Mayo clinic.
- The systolic blood pressure measurement seems to be much more repeatable than the diastolic blood pressure measurement.
Next steps? I will take these charts into my doctor the next time I go. It will be interesting to hear what she says. But one thing I definitely have is baseline data on my blood pressure. And this chart will easily tell me the impact of any medication or diet I may be on in the future. Pretty powerful.
I am doing exactly the same re BP! After my last doctor visit the end of February, I have start recording my BP on an XmR chart. I have reduced my BP med. (Lisinopril) from 10 to 5 mg/day and we are watching the results. The reason for the reduction was the result of a "lower" reading in the doctors office!! So far, the Sys. readings look about the same, but the Dia. readings are a little higher. I will continue to monitor and keep doctor informed. Plan to bring charts and data to next office visit.
This is a very useful & vital
Bill, this is awesome! I’ve done a much less thorough job tracking my BP using SPC too. How cool! Thanks,