September 2007
In This Issue:
- Measurement System Variability
- Stability
- Stable Measurement System
- Unstable Measurement System
- Summary
- Quick Links
This newsletter is the first in a series on variable measurement systems and how to understand the impact these measurement systems have on your operations. Over the next few newsletters, we will be examining stability, bias and linearity as well as repeatability and reproducibility (Gage R&R).
Measurement systems are extremely important in continuous process improvement. We must measure to know where we are. We use measurements to tell us if there is a problem in the process or if a process change has improved the process. For measurements to be effective, they must be timely, accurate, and precise. Many of our customers, both internal and external, rely on our measurements. So how do we provide measurements that are meaningful? This question will be answered over our next few newsletters. We begin with a focus on the stability of the measurement system.
Measurement System Variability
We rely on measurements to tell us when our process is operating correctly, when there is a problem, or when we have made an improvement. When we take a measurement, we often assume that the measurement result is the “true” value of our sample. Unfortunately, this is not true. Measurement systems, like any other process, are subject to variation. You will not always get the same result, for example, when you run a sample again or take another temperature measurement.

Suppose you are producing a granular product that you ship in 50-pound bags. Each bag is weighed on a scale. The scale is a measurement system. It has variation just like the process that is producing the granular product. What happens if the scale is not stable? Suppose the scale suddenly begins giving a result that is a pound lighter than it should be? For example, you actually have 51.5 pounds in the bag, but the scale reads it as 49.5 pounds. Suppose this happens continuously, over and over. You can easily see what can happen if the measurement systems varies. The measurement system has to be stable. This is the key. Only then can you begin to improve the measurement system.
Stability

The American Heritage on-line dictionary defines stability as the following:
“The state or quality of being stable, especially:
- Resistance to change, deterioration, or displacement.
- Constancy of character or purpose; steadfastness.
- Reliability; dependability”
Measurement systems have to be reliable and dependable. Before you can run an analysis of your measurement system, it must be stable. This means that your measurement system must be in statistical control – it must be consistent and predictable. The only way to know this is by monitoring the measurement system using a control chart. This is how the stability of the measurement system is determined.
The procedure for determining the stability of a measurement system using control charts is given below.
Obtain a standard
Determine what the expected range of results is for a given measurement system. This is the range you would expect from production samples over time.
Ideally, you would like to compare your measurement system to a traceable standard. For example, scales often have weights that serve as standards. Quite often, however, this is not possible. In that case, select a part from production that falls in the center of the expected range of results and designate it as the master sample for the stability analysis.
If you are in the process industries, you do not make parts. You produce liquids, gases and solids. For example, you may produce polyvinyl chloride resin. In these situations, select a certain amount of material that will serve as the standard for the stability analysis. You might select a 50-pound bag of resin to serve as the master sample. Again, be sure it is in the center of the expected range of results. Thoroughly mix the material to make it as homogeneous as possible.
If you believe that the measurement system may not be stable over the range of the expected results, you may want to select standards at the high and low ends of the expected range as well as the middle. In this case, you will have three control charts.
Measure the master sample on a regular basis
The master sample is tested over and over on a regular basis. How often depends on how often the measurement system is used. For example, if the measurement system is used on each shift, run the master sample once on each shift. If it is used daily, run the master sample each day. The master sample should be run just as any other sample would be run. This means that different operators will be testing the master sample and that it will be run at different times of the day. The key is to be sure that all the potential sources of variation in the measurement system have an opportunity to be present over time.
Plot the results using an X-mR control chart.
The master sample results are plotted on an individuals (X-mR) control chart over time. After about twenty samples have been taken, the control limits can be calculated.
Bring the measurement system into statistical control by finding and eliminating special causes.
The control chart on the master sample results is then interpreted for out-of-control situations (for example, points beyond the control limits, seven in a row above or below the average). For more information on interpreting control charts, see our April 2004 newsletter available on the website. Any special causes indicated on the control chart need to be investigated. The root cause should be found and eliminated. Once there are no special causes, the measurement system is in statistical control. You are ready to do further analysis on the measurement system.
Below we examine two examples: one of a stable measurement system and one that is unstable. If you have an unstable measurement system, you cannot trust the results you are getting.
Stable Measurement System
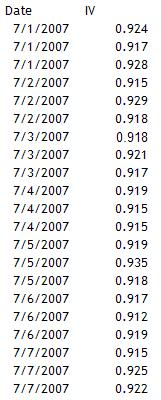
One characteristic of interest in polyvinyl chloride (PVC) resin is the inherent viscosity (IV). The higher the IV, the higher the molecular weight of the resin and the greater the stiffness. For extrusion, an IV of 0.85 to 0.98 is desirable. Extrusion applications include piping and siding. A PVC producer wants to examine the measurement system for IV. A bag of PVC resin has been set aside to serve as a master sample. Since the IV is run on every shift, the decision is made to test the master sample once per shift. There are three shifts per day. The data for the first week of testing is given in the table below. This data is used to construct a X-mR chart for the IV measurement system.
Information on constructing an X-mR chart is available on our website in our October 2006 newsletter. The X and moving range charts are shown below. Both are in statistical control. Thus, the IV measurement system is stable and further analysis can be done on the tests. These analyses include bias, linearity and gage R&R, which we will cover in the next three newsletters.
Unstable Measurement System
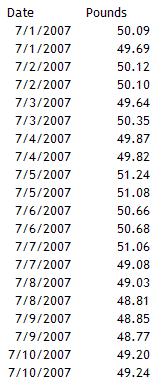
A company produces sand that goes into 50-pound bags. Each bag is weighed to be sure it is within a tolerance of +/- .25 pounds. To check the scale, a standard weight is weighed twice a day. The results for the past ten days are shown in the table below. This data is used to construct an X-mR chart.
The X and mR chart are shown below. Both charts are out of control. Two points are out of control on the moving range chart. The X charts shows runs above and below the average, indicating shifts in the average. This measurement system is not in statistical control. It is not stable. Any further work on analyzing the measurement system for bias, linearity, and repeatability will not be useful. You must first bring the measurement system into control.
Summary
The first step in analyzing the performance of a measurement system is to ensure it is stable, i.e., in a state of statistical control. This is determined by finding a master sample, measuring it over time, and plotting the results on an X-mR chart. The X-mR chart is then analyzed for statistical control. It there are out-of-control points present, the causes of these must be eliminated. Once there are no out-of-control points, the measurement system is stable and further analysis can be done.
It should be noted that all critical measurement systems should monitored regularly, using the above methodology. This is the only way to ensure that these measurement systems stay stable over time.
Next month we will continue our examination of measurement systems.