July 2008
In this Issue:
- Review of Part 1
- Regression Output
- ANOVA Table
- Coefficients Output
- Regression Statistics
- Summary
- Quick Links
This month is the second part of a series on linear regression. Linear regression can be used to mathematically define the relationship between two variables. We often want to know how the changes in one variable affect another variable. There is sometimes a straight line relationship between two variables. Linear regression helps us define this relationship. The major objective is to determine if one variable can be controlled by controlling another variable. Linear regression helps us build a model of the process. This is one method of decreasing process variation.
In the first part of the series, we saw how to develop the best fit equation for a series of data. This part is available on our website (click here to see the first part). In this part, we will explore how to determine if the equation is statistically significant.
Review of Part 1
The example we used in Part 1 is from the book Introduction to Linear Regression Analysis (Montgomery, Peck and Vinning, 4th edition, Wiley & Sons, 2006). The shear strength of the bond between two types of propellant is important in the manufacturing of a rocket motor. Someone asked the question, “Is the age of the propellant related to the shear strength?” To answer this question, twenty paired observations of shear strength and age of the propellant were collected. The data is shown in the table below. You can download the workbook containing the data and the results from our website (click here).
| Observation | Shear Strength, Y (psi) | Age of Propellant, X (weeks) |
|---|---|---|
| 1 | 2158.7 | 15.5 |
| 2 | 1678.15 | 23.75 |
| 3 | 2316 | 8 |
| 4 | 2061.3 | 17 |
| 5 | 2207.5 | 5.5 |
| 6 | 1708.3 | 19 |
| 7 | 1784.7 | 24 |
| 8 | 2575 | 2.5 |
| 9 | 2357.9 | 7.5 |
| 10 | 2256.7 | 11 |
| 11 | 2165.2 | 13 |
| 12 | 2399.55 | 3.75 |
| 13 | 1779.8 | 25 |
| 14 | 2336.75 | 9.75 |
| 15 | 1765.3 | 22 |
| 16 | 2053.5 | 18 |
| 17 | 2414.4 | 6 |
| 18 | 2200.5 | 12.5 |
| 19 | 2654.2 | 2 |
| 20 | 1753.7 | 21.5 |
The data were used to develop the best fit equation for data. The best fit equation has the following form:
where Y is the predicted value of y (shear strength) for a given value of X (age of propellant) once b0 and b1 have been determined. b1 is the slope of the line. b0 is the y-intercept (where the line crosses the y axis). The calculations for the best fit equation are given in Part 1 of this series.
The best-fit equation and the chart are shown below.
Y = 2627.82 -37.15X
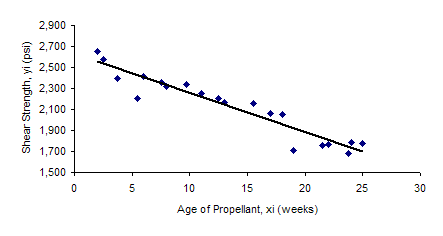
The slope, b1, means that, on average, the shear rate decreases by 37.15 for each additional week of age for the propellant. Note that this model can be used to improve the process. For example, if the minimum shear strength is 2100, the age of the propellant can’t be more than 14 weeks.
The model appears to fit the data fairly well. The analysis below is used to see if this is really a good model for the data.
Regression Output
Most software programs generate output that can be used to determine if the model is statistically significant. Microsoft Excel has a built-in regression function. The output for this data from Excel is shown below.
Regression Statistics
| Multiple R | 0.9497 |
| R Square | 0.9018 |
| Adjusted R Square | 0.8964 |
| Standard Error | 96.1061 |
| Observations | 20 |
ANOVA
| df | SS | MS | F | Significance F | |
| Regression | 1 | 1527482.7 | 1527482.7 | 165.4 | 1.64334E-10 |
| Residual | 18 | 166254.9 | 9236.4 | ||
| Total | 19 | 1693737.6 |
| Coeff. | Stand. Err. | t Stat | P-value | Lower 95% | Upper 95% | |
| Intercept | 2627.82 | 44.18 | 59.47 | 4.06E-22 | 2535.00 | 2720.65 |
| Propellant Age | -37.15 | 2.89 | -12.86 | 1.64E-10 | -43.22 | -31.08 |
This output is fairly typical of most software packages. Our SPC for Excel software has a regression module that provides much more information than Excel does, but we will use the output from Excel here. Our objective here is to understand what this output is telling us about the model.
ANOVA Table
We begin by examining the Analysis of Variance (ANOVA) table. This table tells us the precision of the regression. The general format of the ANOVA table is given below. This will be used to explain the regression results.
Analysis of Variance (ANOVA) Table
| Source | DF | Sum of Squares | Mean Square | F |
| Regression | 1 | SSREG = S(Ypi – Y)2 | SSreg/1 | MSreg/MSres |
| Residual | n-2 | SSRES = S(Yi – Ypi)2 | SSres/(n-2) | |
| Total | n-1 | SSTOTAL = S (Yi – Y)2 |
Ypi is the estimated value of Y using the best fit equation (the model). Y is the average of the Y results. n is the number of observations. A subscript “i” denotes the ith observation for Y.
There are three sources of variation listed in the regression ANOVA table. These are regression, the residual, and the total. We will start with the third column: the sum of squares.
For regression, you can see from the table that the sum of squares due to regression (SSREG) is the sum of the squares of the predicted values (Ypi) minus the overall average (Ybar). This is a measure of how far (how much variation) each predicted value is from the overall average.
SSREG = S(Ypi – Y)2
The residual sum of squares (SSRES) is the sum of the square of the observed value (Y) minus predicted value (Ypi).
SSRES= S(Yi – Ypi)2
The residual is the “error” term. It measures how “close” the model predicts the actual results. If the model is good, the sum of squares due to regression will be much larger than the sum of squares due to the residual (error).
The third sum of squares is the total sum of squares (SSTOTAL). This is the sum of the squares of each observed value (Y) minus the overall average (Ybar). It is a measure of how far (how much variation) each observed value is from the overall average.
SSTotal = S (Yi – Y)2
Note that the following is true:
SSTOTAL = SSREG + SSRES
It is important to remember that the sums of squares are measures of variation. We want the sum of squares due to regression to be much larger than the sum of squares about the regression. If this is the case, it means that the model is statistically significant.
The calculations for the ANOVA table are contained in the workbook that can be downloaded from our website (click here to download the workbook).
The next column to consider in the ANOVA table is the “df” column. “df” is the degrees of freedom associated with each sum of squares. It is a measure of how much independent information you have. There are n-1 degrees of freedom for the total sum of squares, one for the regression sum of squares (since there is only one X), and n -2 for the residual sum of squares. Since there are 20 observations in this example, the following is true:
- Total degrees of freedom (DFTOTAL) = 20 – 1 = 19
- Regression degrees of freedom (DFREG) = 1
- Residual degrees of freedom (DFRES) = 20 – 2 = 18
The mean square column is obtained by dividing each sum of squares by its degrees of freedom. The mean square for the residuals is often called the Mean Square Error (MSE). When the model is correct, MSE provides an estimate of the variance about the regression. Then for this example,
Mean Square Regression = SSREG/DFREG = 1527482.7/1 = 1527482.7
Mean Square Residual (Error) = SSRES/DFRES = 166254.9/18 = 9236.4
The F value is obtained by dividing the Mean Square for regression by the Mean Square for the residual. This F value is the ratio of two variances: the mean square for regression and the mean square residual. The F distribution is a probability distribution based on the ratio of variances. We will use the value of F to determine if the model fits the data. For this example,
F value = Mean Square Regression/Mean Square Residual = 1527482.74/9236.4 = 165.4
The column in the ANOVA table labeled “Significance F” gives us the probability that the mean square regression and the mean square residual are the “same.” If the probability listed in this column is 0.05 or less, it is customary to assume that there is evidence that the two variances are not the same – that the model is significant because there is a significant difference between the two.
You can obtain this probability using the FDIST function in Excel. The form of the function for this data is FDIST(F value, DFreg, DFres) = FDIST(165.4, 1, 18). The significance for F listed in the ANOVA table is 1.6433E-10 which is less than 0.05. Thus we conclude that the model explains a significant portion of the variation in Y and is statistically significant. The general guidelines for interpreting the Significance of F column are given below.
- Significance F < 0.05 Model is statistically significant
- 0.05 <= Significance F < 0.20 More data are needed to reach a conclusion
- Significance F >0.20 Model is not statistically significant
Coefficients Output
The information below the ANOVA table in the output gives information about the parameters estimated for the model.
The column “Coefficient” gives the least squares estimates for b0 and b1 (the intercept and the age of the propellant coefficients). We calculated these coefficients manually in Part 1 of this series.
The “Standard Error” column gives the standard errors of the least squares estimates of b0 and b1. These are the estimated standard deviations of b0 and b1.
The “t Stat” column is the t statistic for b0 and b1. It is calculated by dividing the coefficient by the standard error for the coefficient. For example:
t stat for b1 =-37.15/2.89 = -12.86
The “p-Value” column contains the p value associated with the t statistic. It essentially answers the question of what is the probability that I will get the t statistic if the coefficient is actually zero (that is, does not impact the Y variable at all). The p value is calculated using the two-tailed t distribution. For example, you can calculate the p value for b1 using Excel’s built-in TDIST function:
p value for b1 = TDIST(59.47, 18, 2) = 1.644E-10
The 18 in the above function is the degrees of freedom which is n – k where k is the number of parameters. In this example, there are 20 observations and two parameters (b0 and b1).
You may apply the following guidelines for the p values:
- p value < 0.05: conclude that the coefficient is significant
- p value > 0.20: conclude that the coefficient is not significant
- 0.05<= p value < 0.20: the coefficient may or may not be significant
The columns “Lower 95%” and “Upper 95%” values define a 95% confidence interval for b0 and b1. The confidence limits are calculated using the following:
Coefficient +/- t*standard error
where t is the t value for 18 degrees of freedom and an alpha of 0.05. The t value can be found in a table of t values or by using Excel’s TINV function. For 18 degrees of freedom and an alpha of 0.05, t = 2.100. The 95% confidence interval for b1 is then:
-37.15 – (2.1*2.89) < b1 < -37.15 + (2.1*2.89)
-43.22 < b1 < -31.08
The coefficient is significant if the interval does not contain zero.
Regression Statistics
The top part of the output provides some general regression statistics. These are defined below.
R Square: this measures the proportion of the total variability explained by the model. It is calculated as 1 – (SSRES/SSTOTAL). In this example, the model explains 90.81% of the variability.
Adjusted R Square: this is the value of R square adjusted for the size of the model. It is calculated as:
1-(SSRES/dfRES)/(SSTOTAL/dfTOTAL)
In this example, the adjusted R square is 89.64%.
Standard error: this is the square root of the mean square residuals.
Observations: the number of observations (20 in this example).
Summary
In the regression output above, there are 3 key things to look for:
- R Square Value: this value should be 80% or more; this means that the model explains at least 80% of the variation in Y.
- Significance F: this value should be less than 0.05; this means that the model is statistically significant.
- P value for coefficients: the value should be less than 0.05; this means that the parameter is statistically significant and can be included in the model
If the three above conditions are true, the model is potentially a good model for the process. If these three conditions are not met, then the model needs more work.