December 2019
(Note: all the previous SPC Knowledge Base in the measurement systems analysis category are listed on the right-hand side. Select this link for information on the SPC for Excel software.)
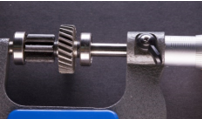
One thing that is overlooked sometimes is the operator-part interaction. This type of interaction occurs when an operator measures a part differently from other operators. If an operator-part interaction exists, it needs to be corrected. It is a sign of inconsistency in the measurement system.
This month’s publication examines how this type of interaction can be seen in a control chart that often accompanies the Gage R&R analysis. In this issue:
- The Gage R&R Study
- Example 1: No Operator-Part Interaction is Present
- Example 2: An Operator-Part Interaction is Present
- Summary
- Quick Links
You may download a pdf copy of this publication at this link. Please feel free to leave a comment at the end of the publication.
The Gage R&R Study
Basically, a Gage R&R study is designed to determine how much of the total variance in the product measurements is due to the measurement system. Better measurement systems are responsible for less of the total variance. Our SPC Knowledge Base has over 25 articles devoted to measurement systems analysis – a wealth of free knowledge about the various measurement systems analysis techniques.
There are two examples given below. The first example involves 3 operators. Each operator measures four parts three different times. The second example involves 3 operators measuring the same five parts two times. The results are analyze using the basic EMP Study. This study is covered in detail in our SPC Knowledge Base article Evaluating the Measurement Process – Part 2. EMP, in our opinion, is the methodology that gives you the most information about your measurement system.
Example 1: No Operator-Part Interaction is Present
The data from the Gage R&R study for this example is shown in Table 1.
Table 1: Gage R&R Study Data for Example 1
| Operator | Part | Result | Operator | Part | Result | Operator | Part | Result | ||
|---|---|---|---|---|---|---|---|---|---|---|
| A | 1 | 212.40 | B | 1 | 212.40 | C | 1 | 212.35 | ||
| A | 1 | 212.35 | B | 1 | 212.35 | C | 1 | 212.45 | ||
| A | 1 | 212.35 | B | 1 | 212.35 | C | 1 | 212.45 | ||
| A | 2 | 212.45 | B | 2 | 212.45 | C | 2 | 212.45 | ||
| A | 2 | 212.45 | B | 2 | 212.45 | C | 2 | 212.50 | ||
| A | 2 | 212.45 | B | 2 | 212.45 | C | 2 | 212.50 | ||
| A | 3 | 212.40 | B | 3 | 212.45 | C | 3 | 212.35 | ||
| A | 3 | 212.40 | B | 3 | 212.40 | C | 3 | 212.40 | ||
| A | 3 | 212.40 | B | 3 | 212.35 | C | 3 | 212.45 | ||
| A | 4 | 212.10 | B | 4 | 212.10 | C | 4 | 212.20 | ||
| A | 4 | 212.15 | B | 4 | 212.25 | C | 4 | 212.35 | ||
| A | 4 | 212.20 | B | 4 | 212.25 | C | 4 | 212.25 |
These data were analyzed using the basic EMP study technique. An Excel file of the output for the basic EMP study from the SPC for Excel software can be downloaded at this link. This includes the results for both examples. Part of the output is the control chart based on the operator-part results. This is the control chart where you check for operator-part interaction.
This control chart is created by forming a subgroup based on the results for each operator and part. For example, the first subgroup represents the three results for operator A measuring Part 1:
212.40, 212.35, 212.35
The average of these three results is calculated. The average is 212.37.
The subgroup range is then calculated. The subgroup range is the maximum value – minimum value or 212.40 – 212.35 = 0.05 for this subgroup. What is the source of variation in the first subgroup? The first subgroup is for Operator A and Part 1. So, the operator and the part are the same. The variation in results is due to the measurement system – it is a measure of the test-retest error.
The subgroup average is plotted on the averages chart. The subgroup range is plotted on the range chart. This is done for all the operator-part combinations. The range chart is not shown here but can be viewed in the workbook referenced above. The R chart shows the results for the repeated measurements for each operator for each part. It is a check of the consistency of the measurement process between the operators. There are no out of control points on the R chart.
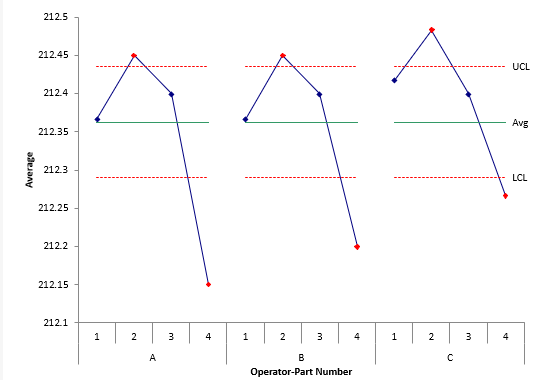
The X chart is shown in Figure 1 below. Each subgroup average is plotted; the overall average and control limits are calculated and added to the chart.
Figure 1: X Control Chart for Example 1
The average range, which is a measure of the test-retest error, is used to calculate the control limits. This means that you want out of control points. It is an indication that the measurement system can tell the difference between parts. For this type of chart, the range between the LCL and the UCL represent the variation that is obscured by measurement error.
This is the chart that you use to check for operator-part variation. You want to focus on the pattern of variation for each operator. Remember that the variation between the control limits is obscured by measurement error. You should focus on the points beyond the control limits. These are the points that are out of control – they are significantly different than the average. The operators should agree on these points.
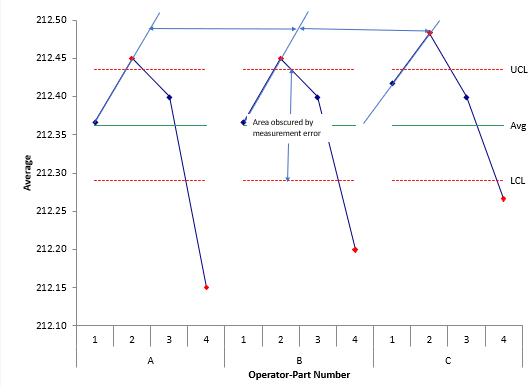
You look at the chart looking for parallelism between the lines connecting the out of control points. Figure 2 shows this process.
Figure 2: Examining Example 1 Chart for Operator-Part Interaction
Figure 2 shows the range between the control limits that is obscured by the measurement error. You don’t worry about patterns within the control limits. You want to see what is happening with the out of control points. For example, consider the two results for operator A and parts 1 and 2: A-1 and A-2. A-2 is out of control. To help see if parallelism exists, you can draw lines through the results for A-1 and A-2. Do the same thing for B-1 and B-2 and then for C-1 and C-2. You can see the lines in Figure 2. The lines are close to parallel. This implies that there is no operator-part interaction for those two parts.
You don’t have to really draw in the lines – just look to see if the patterns look parallel for the entire chart – not just two parts. You can see the patterns for the other parts are also parallel. The conclusion in this example, is that there are no operator-part interactions.
Example 2: An Operator-Part Interaction is Present
In this study, three operators measure the same five parts three times each. The resulting data is given in Table 2.
Table 2: Gage R&R Study Data for Example 2
| Operator | Part | Result | Operator | Part | Result | Operator | Part | Result | ||
|---|---|---|---|---|---|---|---|---|---|---|
| A | 1 | 113 | B | 1 | 112 | C | 1 | 107 | ||
| A | 1 | 114 | B | 1 | 112 | C | 1 | 109 | ||
| A | 2 | 113 | B | 2 | 117 | C | 2 | 120 | ||
| A | 2 | 117 | B | 2 | 110 | C | 2 | 122 | ||
| A | 3 | 71 | B | 3 | 82 | C | 3 | 103 | ||
| A | 3 | 73 | B | 3 | 83 | C | 3 | 101 | ||
| A | 4 | 101 | B | 4 | 98 | C | 4 | 105 | ||
| A | 4 | 97 | B | 4 | 99 | C | 4 | 109 | ||
| A | 5 | 113 | B | 5 | 110 | C | 5 | 101 | ||
| A | 5 | 115 | B | 5 | 108 | C | 5 | 93 |
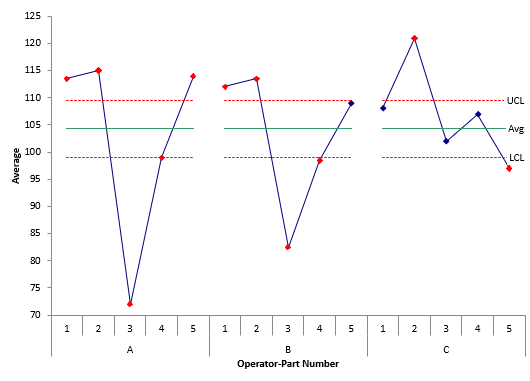
The X chart for these data is shown in Figure 3.
Figure 3: X Control Chart for Example 2
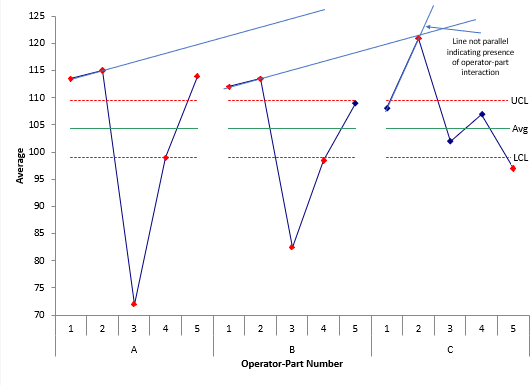
As you look at this chart, note that Operators A and B have a similar pattern to each other in terms of results. Operator C, however, appears to have a different pattern. This is an indication that there is an operator-part interaction. It appears that Operator C measures the part differently than Operators A and B. Figure 4 shows the lines connecting the first two parts.
Figure 4: Examining Example 2 Chart for Operator-Part Interaction
When looking at all the parts, it is clear that there is an issue with Operator C. The reason for this operator-part interaction should be found and corrected.
Summary
This publication examined how to use the X chart to look for operator-part interactions in a Gage R&R study. The X chart plots results by operator-part. When looking at the chart, the patterns of variation for each operator should essentially be the same. Determining this is subjective. You want to focus on the out of control points – the points beyond the control limits. If the patterns do not show parallelism, then there is the presence of operator-part interaction.
The range between the control limits is the area of variation that is obscured by measurement error. You should not expect strong parallelism within the control limits.
Thanks for a good way to see an operator-part interaction.