January 2005
In this issue:
How do you start a control chart? How do you maintain it? What variables should you chart? These questions are common as you begin to use SPC. This e-zine answers these three questions.
Starting a Control Chart

For example, suppose I work in a chemical plant and want to reduce the amount of one contaminant in a waste stream to meet government regulations. I can use a control chart to do the following:
- To determine the average amount
- To determine the spread about the average
- To determine if the process is in control (only common cause variation, see Jan 2004 e-zine on the website)
- To show the result of improvement efforts
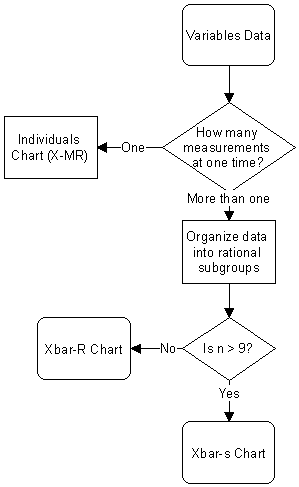
Once you have established an objective, the next step is to select the type of control chart to use. The figure above can be used to select the correct control chart for variables data. For the process we are looking at, we are dealing with measurement data. The waste stream is measured once a day for the contaminant. Since there is only one measurement at a time, the individuals chart is selected. If you are dealing with measurement data where you have more than one value at a time, you will need to make decisions on how often the data will be collected and the size of the subgroup.
Historical data will often be available. Historical data can and should be used to begin a control chart if it is available. There will be times when no historical data are available. In this case, data collection must begin.
Once sufficient data (including historical data, minimum of twenty points) are available and plotted, the overall process average and control limits can then be calculated and added to the control chart. The chart can then be used to determine if the process is in statistical control. If there are out-of-control points, you may want to try and find out what caused them. However, in some cases, this will be difficult. If you are charting weekly data, the out-of-control situation could have happened anytime in the past one to twenty weeks. Suppose week two is out of control. It may be difficult to find out what happened eighteen weeks ago. It may not be worth the time and energy it would take.
You should remove any out-of-control points from the calculation. This will provide better estimates of the average and control limits with just common causes of variation present.
Maintaining a Control Chart
The amount of time required to keep the chart up to date is minimal in most cases. For example, if you are examining weekly sales figures, you will only plot one point per week once the chart has been established. If you are looking at the fraction of invoices with errors on a daily basis, you will only plot one point per day. In a manufacturing plant, no more than one point per hour will probably be plotted. Upkeep of the charts is not time consuming. Looking for special causes can be.
The control chart has now been established. Each time a new data point is available it is plotted. Now if an out-of-control point occurs, front-line personnel should look for the cause. Since the out-of-control point just occurred, it will be easier to find the reason why.
Two possibilities exist once the chart has been established. One possibility is that the process is in control. This will normally not be the case since being in statistical control is not the natural state. However, if this is true, you can begin looking at methods of changing the system to improve the process. The second possibility is that the process is out of control. If this is the case, special causes should be identified and removed. Control strategies are useful for accomplishing this (October 2004 e-zine available on the website). Over time, the process will come into control. This requires at least twenty points in a row being in statistical control. Then you can begin looking at methods of changing the system to improve the process.
An important point to remember is that control charts do not tell us how to improve our processes. They do tell us if any changes we make have an effect. The problem-solving model (May 2004 e-zine available on the website) provides a guide to help us determine how to improve our processes.
When is it appropriate to stop charting? There are several cases when you may want to stop charting. One case is if the chart is not helping you. There is no sense in plotting points on a control chart if you aren’t being helped. Another case may be after the process has been improved sufficiently. Caution should be taken here, however. Remember that being in control is not the natural state. If you stop charting, it is possible that the process will reach a state where it is no longer in statistical control. You may want to consider keeping the chart, but taking data less frequently.
What Should Be Charted

Process variables: Process variables are the process parameters over which there is direct control. They are the parameters set by the front- line personnel, i.e., the “knobs” used to control or adjust the process. In statistical terms, process variables are the independent variables. Process variables include variables such as temperature and pressure, the levels of which are determined by set point controllers.
There are two types of process variables. Fixed process variables are those controlled at set conditions. For example, if a furnace is controlled at one set temperature at all times, the furnace temperature is a fixed process variable. Adjustable process variables are those whose target values are changed to achieve a different end result in the product. An example of an adjustable process variable is reactor temperature in polyvinyl chloride polymerization. The reactor temperature is adjusted to produce the desired molecular weight resin.
Process variables are not responses. They do not have the random variation that is required for control chart usage. Thus, control charts are not needed for process variables. Control is obtained through operator monitoring and log sheets. One may want to show control over the process variables by use of run charts, such as those obtained from strip chart recorders.
It is possible to use process variable data to analyze the frequency of adjustment needed by operators to maintain the process variables at set points. This will identify process variables that exhibit frequent problems. Ways to correct this type of problem include repairing the controller, installing a more accurate controller, or increasing the frequency of operator monitoring.
One question that must be addressed about process variables is, “Are the process variables at their optimum setting?” Experimental design techniques should be used to answer this question once the process is stable.
Process Responses: Process responses are measurements determined primarily on-line that relate to the quality of the product being produced. In statistical terms, process responses are dependent variables. They are affected by process variable settings, raw materials used, the environment, etc. Process responses can be controlled only indirectly.
In some cases, process responses correlate with important product characteristics. Correlations can be determined by use of scatter diagrams. If correlations exist between a process response and an important quality characteristic, control charts should be used to monitor the process response over time.
Product responses: Product responses are measurements made on the product for purposes of controlling the process or controlling the product to be shipped. These measurements are normally measured off-line, e.g., in the laboratory. Examples include purity, color, bulk density, etc. Control charts should be used to monitor important product responses.
In most cases, manufacturing units will begin a quality improvement process by monitoring product responses. The objective should be to move the monitoring upstream to process responses once correlations have been established. Monitoring the process responses and having the process variables set at the optimum settings will ensure that the product is made right the first time.