September 2009
In this issue:
The Guest Author
 This month’s newsletter is written by Nabil B. Darwazeh, Ph.D. Dr. Darwazeh is currently a Research and Development Technical Advisor and Process Scale-Up Manager at United Pharmaceutical, Amman, Jordan. Before Joining United Pharmaceutical, he was Senior Research Scientist at Wyeth Pharmaceuticals, Pearl River, NY, and Research Scientist at Mallinckrodt Veterinary, Mundelein, IL.
He received his Bachelor’s Degree in Agriculture Sciences from University of Baghdad in 1980, and his Master’s Degree in Animal Science from California State University in 1983. Dr. Darwazeh received the Ph.D. Degree in Medicinal Chemistry and Pharmaceutical Sciences from University of Kentucky in 1995. Dr. Darwazeh is a member of the International Society for Pharmaceutical Engineering (ISPE). A special thanks to Dr. Darwazeh for sharing his insights into the use of SPC in the pharmaceutical industry.
Introduction
Pharmaceutical manufacturing is a multi-steps process. Each manufacturing step is called a “Unit Operation” Each unit operation produces an intermediate with pre-determined quality specifications that will ensure the quality of the finished product.
Pharmaceutical dosage forms, such as tablets, are widely used in today’s drug product manufacturing. In tablet production, weighing, blending, granulating, compression, coating, and packaging are separate unit operations. A “lot” of powder is processed in each of the unit operation with an objective to reduce the between (inter) lot variability and the within (intra) lot variability.
One of the unit operations in the process of producing tablets is the tablet compression machine. This equipment will apply compression force on the powder mixture containing the active pharmaceutical ingredient and other ingredients. The result of the compression process is a solid entity known as a table. This tablet must have number of critical quality attributes that give the product its identity. Tablet hardness, friability, disintegration, dissolution, and dimensions are some of the important quality attributes to ensure the suitability of the tablet for the intended use.
Tablet hardness (tensile strength) is one critical quality feature for tablet coating, disintegration, dissolution, handling, packaging and transporting. Therefore, monitoring this attribute during the course of the lot compression process is critical.
The process is sampled using stratified sampling techniques. This is the process of sampling dosage units at predefined intervals and collecting representative samples from specifically targeted locations in the compression operations. The test results are used to monitor the manufacturing process output that is more likely to cause finished product variability.
Routine quality monitoring of a production process can be accomplished by process control charts. Depending on the number of process attributes to be monitored, essentially there are two types of control charts. The first, referred to as a univariate control chart, is a graphical presentation (chart) of one quality characteristic. The second, referred to as a multivariate control chart, is a graphical presentation of a statistic that represents more than one quality characteristic
Using SPC in the Pharmaceutical Industry
The following example is to illustrate the application of univariate X -R control chart to monitor the in-process quality control of the tablet compression process. We are using the tablet hardness as a critical quality attribute for demonstration.
A pharmaceutical company would like to evaluate a tablet compression process for a new drug product. Pre-determined numbers of samples (subgroups) were taken at equally spaced time intervals during the entire lot compression process.
Ten tablets were taken at random from each subgroup and the hardness of each tablet was measured using tablet hardness tester. The following table displays the test results of individual tablets from 10 consecutive samples of 10 tablets each as well as sample descriptive statistics. The results are expressed as a % of the target value.
| Sample | Tablet Hardness Results Expressed as a Percent of Target Value | |||||||||
| 1 | 94.4 | 100.4 | 97.0 | 95.3 | 100.2 | 95.0 | 97.5 | 99.5 | 103.2 | 96.6 |
| 2 | 95.7 | 90.0 | 96.0 | 97.8 | 97.2 | 93.0 | 97.6 | 89.8 | 94.0 | 95.0 |
| 3 | 98.7 | 99.6 | 100.5 | 97.3 | 98.6 | 101.3 | 98.3 | 101.3 | 98.9 | 91.0 |
| 4 | 97.2 | 95.3 | 94.0 | 95.6 | 92.3 | 95.6 | 92.6 | 94.0 | 95.2 | 98.0 |
| 5 | 93.2 | 95.7 | 98.6 | 99.3 | 97.8 | 92.1 | 99.0 | 87.3 | 98.7 | 95.0 |
| 6 | 97.3 | 95.7 | 94.8 | 95.4 | 97.8 | 92.3 | 98.4 | 94.2 | 93.4 | 90.2 |
| 7 | 114.0 | 98.0 | 101.1 | 106.7 | 97.0 | 96.0 | 98.8 | 97.8 | 95.6 | 96.2 |
| 8 | 95.6 | 95.9 | 97.3 | 94.5 | 102.2 | 97.4 | 98.0 | 95.2 | 97.6 | 97.1 |
| 9 | 96.5 | 98.6 | 98.8 | 96.3 | 97.4 | 97.5 | 100.2 | 98.9 | 101.3 | 98.4 |
| 10 | 94.3 | 94.3 | 97.0 | 89.7 | 95.8 | 97.6 | 97.6 | 95.0 | 89.4 | 94.0 |
The results were analyzed using an X-R control chart. The first step is to calculate the sample averages and ranges. This has been done in the table below.
| Sample | Average | Range |
| 1 | 97.9 | 8.8 |
| 2 | 94.6 | 8.0 |
| 3 | 98.6 | 10.3 |
| 4 | 95.0 | 5.7 |
| 5 | 95.7 | 12.0 |
| 6 | 95.0 | 8.2 |
| 7 | 100.1 | 18.4 |
| 8 | 97.1 | 7.7 |
| 9 | 98.4 | 5.0 |
| 10 | 94.5 | 8.2 |
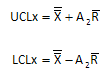
The overall average is 96.7 with an average range of 9.2. The control limits for the X control chart are given below. UCLx is the upper control limit; LCLx is the lower control limit. A2 is a control chart constant that depends on subgroup size (n = 10 in this example).
The control limits for the range chart are shown below. ULCr is the upper control limit; LCLr is the lower control limit. D4 and D3 are control chart constants that depend on the subgroup size.

For more information, please see our March 2005 and April 2005 newsletters on X-R control charts. This was followed by a two-part series (May 2005 and June 2005) on rational subgrouping and the role this plays in setting up X-R control charts.
The X-R control charts were made using the SPC for Excel Version 4 software. The X chart is shown below.
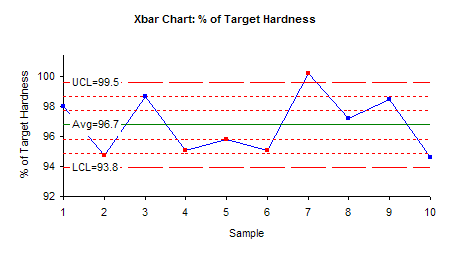
The X chart indicates that overall variability of the process is within the control limits with the exception of one result. The mean of sample 7 is above the upper control limit. By closely inspecting the individual tablet hardness values in the first table, it shows that the hardness of tablet 1 of sample 7 was unexpectedly high (114) compared to all other tablets. This high value caused the mean of this sample to be shifted above the upper limit.
Thus, the X chart is sending a statistical signal that there was a special cause of variation in sample 7. The reason for this special cause of variation should be found and eliminated from the manufacturing process.
Note that the X chart also shows out of control points for samples 2, 4, 5 and 6. This is the case of four out of five consecutive results being in zone B or beyond (please see our April 2004 newsletter for more information on how to interpret control charts.) If sample 7 is removed from the calculations, this will probably not be an out of control situation.
The range control chart is shown below.
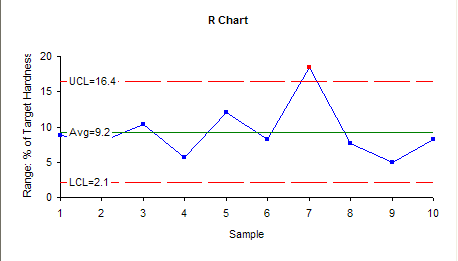
From the R chart, it indicates that variability of the process is quite stable except the range of sample 7 which shows out of control point. This evidently can be attributed to the same reason of the same sample mean in X control chart.
It is clear from this simple control chart analysis one can monitor the process variation and assess if the process mean is shifting. Furthermore, X-R control chart analysis, in the same way, can be applied to evaluate lot-to-lot variations due to changes in the raw material lots or compression machines.