May 2023

You check your production processes routinely by taking samples. After all, you want to be sure the process is operating where you want it to. Why don’t you do the same thing for your key measurement systems? After all, they are processes and are subject to process upsets – just like your production processes.
I am amazed that customers don’t require key measurement systems to be monitored over time. A Gage R&R analysis gives the best-case scenario for a moment in time. A Gage R&R analysis will not include all the sources of variation that can occur over time in a measurement system. For example, seldom does a Gage R&R study include all the technicians who will run the analysis. Not to mention that you can influence the Gage R&R results by manipulating the parts used in the analysis.
If you want a moment-in-time result, a Gage R&R analysis is fine. But if you want long-term confidence in a measurement system, you need to monitor the accuracy and precision of a measurement system over time using a control chart approach. This approach involves running a control or standard on a regular basis. Over time, this allows you to capture all the potential sources of variation that impact the measurement system. In addition, it lets you know when your measurement system is broken – a special cause of variation is present. Pretty powerful for a simple approach.
In this publication:
- Introduction
- Accuracy and Precision of a Measurement System
- Control Charts to Monitor Accuracy and Precision
- Process for Monitoring a Measurement System Over Time
- Summary
- Quick Links
Please feel free to leave a comment at the end of this publication. You can also download a pdf copy of this publication at this link.
Introduction
Back in May 2006, we published an article on monitoring test methods using SPC. This publication updates that one.
Measurement systems – our test methods – are very important to us. Why do we take measurements from our processes? There are a variety of reasons. Measurements give us answers to questions. Is our product in or out of specifications? Is the process in statistical control? Is the process getting better or getting worse – or just staying the same? Measurements can make us happy. Or measurements can cause us a lot of grief as we look for the source of the problem indicated by the measurement.
For measurements to be useful, we have to trust the results. How do we trust our measurement system? There are three things that must happen for us to trust measurement results:
- The measurement system must be accurate.
- The measurement system must be precise.
- The measurement system must be consistent and predictable.
And there is only one way to do this – and that is through the use of control charts.
Accuracy and Precision of a Measurement System
We monitor the three items above – accuracy, precision, and stability – when we monitor a measurement system.
Accuracy refers to the absolute correctness of the measurement system relative to a standard. There are many standards. For example, one method of checking the accuracy of a laboratory weigh scale is to put a 10-gram standard weight on the scale and see how much the standard weighs according to the laboratory scale. On average, the laboratory scale should read 10 grams if it is accurate.
Precision of a measurement system refers to how reproducible or repeatable the results are. How close will the results be if the 10-gram standard weight is reweighed over and over? The difference is called precision. The smaller the difference, the more precise the measurement system is.
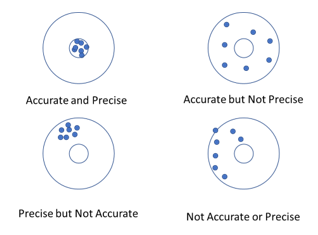
Figure 1 represents another method of developing an understanding of accuracy and precision. The objective is to hit the target’s bullseye.
Figure 1: Accuracy and Precision
The figure in the upper left-hand corner shows a marksman who is precise and accurate. Each shot hits near or in the bullseye (i.e., the marksman is accurate). The difference between successive shots is small (i.e., the marksman is precise).
The figure in the upper right-hand corner shows a marksman who is accurate but not precise. There is a lot of scatter in these results. But if you average all the shots, the average would be close to the bullseye.
A marksman who is precise but not accurate is shown in the lower left-hand corner. His average shot is not near the bullseye. However, the difference between consecutive shots is very low.
The figure in the lower right-hand corner shows an example of a marksman who is not accurate and not precise. There is no telling where the next shot will end up. He is off the bullseye and the differences between shots are very large.
Control Charts to Monitor Accuracy and Precision
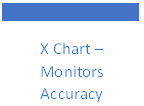
If it is in statistical control (i.e., consistent and predictable), you can use the X chart to determine if the measurement system is accurate. You can simply compare the average ( X) on the chart to the known value of the standard, like the 10-gram weight. If X and the known value of the standard are the “same,” then you conclude that the measurement system is accurate. You ensure that it stays accurate by continuing to run the standard on a regular basis. Not all things have standards. What to do in that case is discussed below.
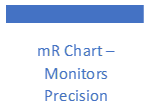
If the mR chart is in statistical control, you can estimate the standard deviation of the measurement system (σe) as follows:
σe = R/d2
This is a measure of the precision of the measurement system. This value is compared to the total variation to determine the % of total variance due to the measurement system. It is this percentage that will tell you if your measurement system is precise. You ensure that the precision doesn’t change over time by continuing to run the standard on a regular basis.
To determine if the measurement system meets your needs, you need to do a few more calculations. You take a sample from your process. You test that sample using your measurement system. You get a result (X1). You take another sample and test that sample. You get another result (X2). Usually, X1 does not equal X2. What are in these results? Two major components are present in each result: the variation in the product itself and the variation in the measurement system.
The basic equation describing the relationship between the total variance, the product variance, and the measurement system variance is given below.
σx2 = σp2 + σe2
where σx2 = total variance of the product measurements, σp2 = the variance of the product, and σe2 = the variance of the measurement system.
The key variable to determine if the precision of the measurement system is “good” enough is the following:
% of Variance due to the Measurement System = σe2/σx2
You know σx from the moving range chart. You can estimate σx from historical production data.
Process for Monitoring a Measurement System Over Time
The basic process for monitoring a measurement system over time contains these seven steps:
- Run a standard or control on a regular basis.
- Plot the results using an individuals control chart.
- Bring the measurement system into control by finding and eliminating special causes.
- Determine the accuracy of the measurement system by comparing the average on the individuals chart to the “true” value of the standard.
- If there is not a standard, assume that the average is the “true” value of the control.
- Determine the precision of the measurement system by calculating the standard deviation of the measurement system from the moving range chart.
- Determine the % of total variance due to the measurement system.
- Continue to monitor the accuracy and precision of the measurement system over time.
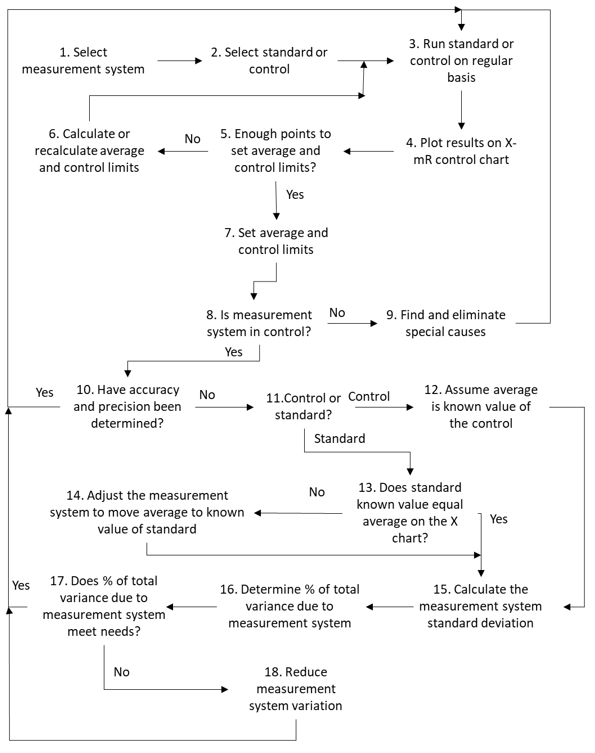
Figure 2 is a more detailed process flow diagram of how to monitor measurement systems over time. The steps are described below.
Figure 2: Monitoring the Accuracy and Precision of Measurement Systems
Assume that there is a production facility where samples are taken from various processes and analyzed in the plant laboratory by lab technicians. Several different measurement systems are in use. A decision has been made to monitor major measurement systems over time for accuracy and precision. The steps below will accomplish this using an example.
Step 1: Select Measurement System
Monitoring a measurement system takes time. To begin with, you want to select measurement systems to monitor that are key to major customers. You may also wish to monitor the measurement systems most important to production.
Example: Assume that we have a powdered product whose viscosity is key to a major customer. We select the viscosity measurements as the system to monitor.
Step 2: Select Standard or Control
Ideally, you would like to monitor the measurement system over time using a standard. This is material with a known (“true”) value – like the 10-gram standard used to monitor a laboratory weigh scale. Not all measurement systems have standards. For example, in the production of our powder, there is no “standard” powder. In this case, you simply put aside a very large sample of material and use this as the control for the future. Ideally you would like the amount of control to last three or more months.
Example: We put aside a large sample of powder to use as a control, thoroughly mixing it as well.
Step 3: Run Standard or Control on a Regular Basis
It is important to run the standard or control regularly. How often is regular? That will depend on your situation but, if the measurement system is run each shift, most likely you will need to run the control or standard at the start of each shift. It is important that whoever does the measurement runs the control or standard. It should not be assigned to one person. You want all potential sources of variation to be present in the long term. This means that whoever measures samples using the measurement system also runs the control or standard.
Example: The control is run at the start of each shift.
Step 4: Plot the Results on the X-mR Control Chart
The individual result from the control or standard is plotted on the X (individuals) chart while the range between consecutive points is plotted on the mR (moving range) chart. Software can be used to track the results and construct the control chart.
Example: The results from running the control each shift are plotted on the two charts. Table 1 shows the results for the first 30 points. The control charts are shown later.
Table 1: Control Data
| Control Number | X | Control Number | X | |
| 1 | 20.196 | 16 | 20.080 | |
| 2 | 20.138 | 17 | 19.894 | |
| 3 | 20.017 | 18 | 20.069 | |
| 4 | 20.294 | 19 | 19.930 | |
| 5 | 20.131 | 20 | 19.971 | |
| 6 | 20.033 | 21 | 20.311 | |
| 7 | 20.193 | 22 | 20.112 | |
| 8 | 19.629 | 23 | 20.084 | |
| 9 | 20.105 | 24 | 21.222 | |
| 10 | 20.102 | 25 | 20.253 | |
| 11 | 19.974 | 26 | 20.199 | |
| 12 | 19.821 | 27 | 19.882 | |
| 13 | 20.110 | 28 | 20.104 | |
| 14 | 19.783 | 29 | 19.810 | |
| 15 | 19.939 | 30 | 19.886 |
Step 5: Enough Points to Set Average and Control Limits?
This question addresses how many data points you need to start a control chart and then when to set the average and control limits to judge future performance. If there are less than 6 points, you really shouldn’t start a control chart. So, you continue to run the control or standard until you have 6 points. If you have less than 30 points, go to Step 6. Otherwise, go to Step 7.
Step 6: Calculate or Recalculate Average and Control Limits
If you are between 6 and 30 points, you should recalculate the average and control limits for both the X and mR charts after each new result from the control or standard is obtained. There are two control limits on the X chart, the upper control limit (UCL) and the lower control limit (LCL). The mR chart only has an UCL. Each chart has an average. Recalculating the average and control limits is easy to do with software.
Step 7: Set Averages and Control Limits
At 30 points, you should recalculate the averages and controls for a final time and then set them, so they do not change anymore. Future performance is judged by these averages and control limits.
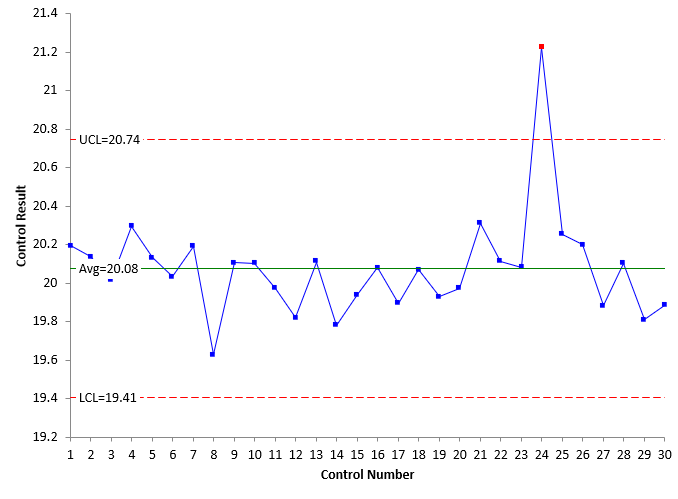
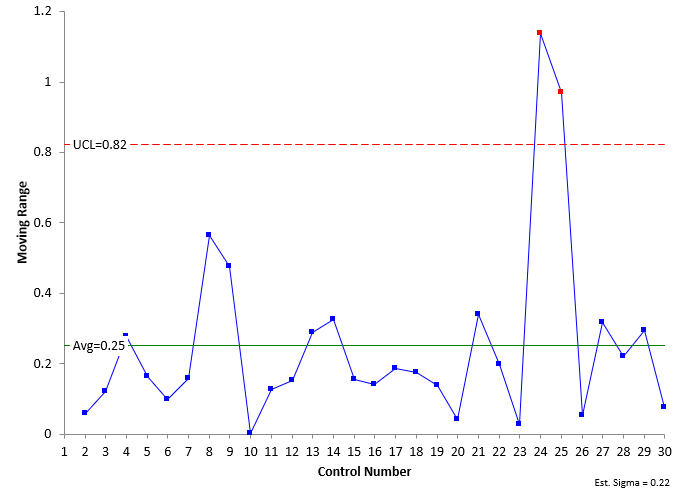
Example: The control limits are set for the future after 30 data points as is shown in Figure 3. The top chart is the X chart; the bottom chart is the mR chart.
Figure 3: X-mR Control Charts with Limits Set for Future Performance
Step 8: Is the Measurement System in Control?
After each new result is added to the control chart, the control charts must be interpreted. This answers the question of whether the measurement system is consistent and predictable. It is consistent and predictable if it is in statistical control. This means that there are only common causes of variation present on the control chart. This is the normal variation in the process. If there are no points beyond the control limits and no patterns, the measurement system is said to be in statistical control. The UCL is the largest number you would expect with just common causes of variation present while the LCL is the smallest number you would expect. Since these are important measurement systems, you want to be able to detect small shifts in the average. So, in addition to using points beyond the control limits, it is also recommended that you use the Zone Tests. For more information on interpreting control charts, please see our SPC Knowledge Base article Which Out of Control Tests Should I Use?.
If the control charts show that the measurement system is out of control, go to Step 9. Otherwise go to Step 10.
Example: The charts are interpreted for statistical control using points beyond the control limits and the zone tests. There is one out of control point on the X chart that leads to two out of control points on the mR chart.
Step 9: Find and Eliminate Special Causes
Special causes are not part of the process; they are abnormal. If present, the process is said to be out of statistical control. Special causes mean that the measurement system is not consistent and predictable. If a special cause is present, it means your measurement system is broken. You don’t know how it will perform in the future. You must find and eliminate the special cause of variation to bring it back into statistical control. Quite often the standard or control is simply rerun to see if it comes back into statistical control. However, if it doesn’t, you must find the reason for the out of control point before running any more tests.
Step 10: Have the Accuracy and Precision of the Measurement System Been Determined?
You cannot determine the accuracy and precision of a measurement system until the measurement system is in statistical control. If you have already determined the accuracy and precision, you simply continue to run the standard or control over time to monitor the measurement system – keeping it in statistical control.
Step 11: Control or Standard?
Determining the accuracy is different depending on whether you have a standard or a control. If you are using a standard go to step 13. If you are using a control, go to Step 12.
Step 12: Assume the Average on the X chart is the “True” Value of the Control.
You continue to monitor the individual result against this average and control limits.
Example: The average line is assumed to be the known value.
Step 13: Does the Standard Known Value Equal the Average on the X Chart?
To determine the accuracy of the measurement system, you compare the known value of the standard to the average on the X chart. If the two values are “close enough”, you assume that the measurement system is accurate. You could also do the sample t test for a mean to see if the interval contains the known standard if you wanted to have more mathematics behind deciding that the measurement system is accurate. If the known standard does not equal the average on the X chart, go to Step 14. If it is, go to Step 15.
Step 14: Adjust the Measurement System to Move the Average to the Known Value of the Standard
If the measurement system is not accurate, you need to figure out how to adjust the measurement system to move the average to the known value of the standard. Experimental design techniques may be useful here.
Step 15: Calculate the Measurement System Standard Deviation
This step starts the calculations to determine the measurement system precision. The average moving range is used to estimate the measurement system standard deviation:
σe = R/d2
This is a measure of the measure system precision. Is it good enough? You need something to compare it against. As shown at the start of this publication, it is compared to the total variance.
Example: We calculate the precision of the measurement system:
σe = R/d2 = 0.25/1.128 = 0.22
Step 16: Determine the % of Total Variance Due to the Measurement System
An estimate of the total variance is needed to compare the measurement system variance against. The best way to get the total variance estimate is from historical data that include enough time for most sources of variation to show in the process. You can construct a control chart
from the historical data and use the average moving range to estimate the total variance (σx2).
% of Variance due to the Measurement System = σe2/σx2
Example: We examine historical production data and from the average moving range find that σx = 0.8. Then:
% of Variance due to the Measurement System = σe2/σx2 = 0.222/0.82 = 7.56%
So, 7.56% of the total variance is due to the measurement system.
Step 17: Does the % of Total Variance due to the Measurement System Meet Needs?
There are several schools of thoughts about what is a “good” value for the % of total variance due to the measurement systems. This is something you will have to decide based on your needs. Is 10% a good value? Is 20% OK for this situation? Perhaps it is Dr. Donald Wheeler’s class of monitors system. You can read about possible criteria in our SPC Knowledge Base article Acceptance Criteria for Measurement Systems Analysis (MSA). If the % of total variance due to the measurement system meets your needs, then you are done. Just continue to run the standard or control on a regular basis. If it does not meet your needs, go to Step 18.
Example: We conclude that is a good measurement system using Dr. Wheeler’s class of monitors system. It is a Class 1 monitor.
Step 18: Reduce the Measurement System Variation
If the % of total variance due to the measurement system does not meet your needs, you will need to work to reduce the variation in the measurement system.
Summary
This publication examined how to monitor a measurement system’s accuracy and precision over time using these basic steps:
- Run a standard or control on a regular basis.
- Plot the results using an individuals control chart.
- Bring the measurement system into control by finding and eliminating special causes.
- Determine the accuracy of the measurement system by comparing the average on the individuals chart to the “true” value of the standard.
- If there is not a standard, assume that the average is the “true” value of the control.
- Determine the precision of the measurement system by calculating the standard deviation of the measurement system from the moving range chart.
- Determine the % of total variance due to the measurement system.
- Continue to monitor the accuracy and precision of the measurement system over time.
