January 2024
 We have taken an annual look at global warming since 2015. We continue that process with this publication, which updates the results with the data from 2023. Back in January 2023, we asked whether 2022 was the hottest year on record since 1880. No, it was not. It was the 6th hottest year. Now, we asked the same thing for the year 2023. Was 2023 the hottest year on record? And the answer is yes, 2023 was the hottest year on record – by far.
Over the years, we have used control charts to see the impact of temperature changes. One approach we used is a trend control chart to analyze the temperature data. The other is the basic control chart that looks for periods of stable temperatures. We will look at both below.
In this publication:
- The Global Temperature Data
- Global Warming as a Trend Control Chart
- Global Warming as Step-Changes in a Control Chart
- Past Global Temperature Publications
- Summary
- Quick Links
Please feel free to leave a comment below. You can download pdf copy of this publication at this link.
The Global Temperature Data
You can access the data used in this publication at this link. It is provided by the Goddard Institute for Space Studies (GISS) website which is part of NASA. You want to download the data that is labelled “Global-mean monthly, seasonal, and annual means, 1880-present, updated through most recent month.”
The data are given as a deviation from the baseline period from 1951 – 1980. For example, the average annual global temperature deviation for 2023 is 1.17 °C. This means that 2023 was, on average, 1.17 °C higher than the baseline mean from 1951 to 1980. The raw data are given as the change in monthly deviations. The 12 months for the year are averaged to give the annual global temperature deviation. Table 1 shows the temperature deviations for each month in 2023.
Table 1: 2023 Monthly Temperature Deviations
|
Month |
Deviation |
Month |
Deviation |
|
|
Jan-23 |
0.87 |
Jul-23 |
1.19 |
|
|
Feb-23 |
0.98 |
Aug-23 |
1.19 |
|
|
Mar-23 |
1.20 |
Sep-23 |
1.48 |
|
|
Apr-23 |
1.00 |
Oct-23 |
1.34 |
|
|
May-23 |
0.94 |
Nov-23 |
1.43 |
|
|
Jun-23 |
1.08 |
Dec-23 |
1.37 |
The average of these 12 months is 1.17, which is reported as the annual global temperature deviation.
Note that all values in Table 1 are positive. That means each month’s temperature deviation was higher than the baseline data. If a value was negative, it would mean that that the monthly temperature deviation was less than the baseline data. This hasn’t happened since September 1992.
Figure 1 shows the annual global temperature deviations from 1880 to 2023.
Figure 1: Annual Global Temperature Deviations from 1880 to 2023
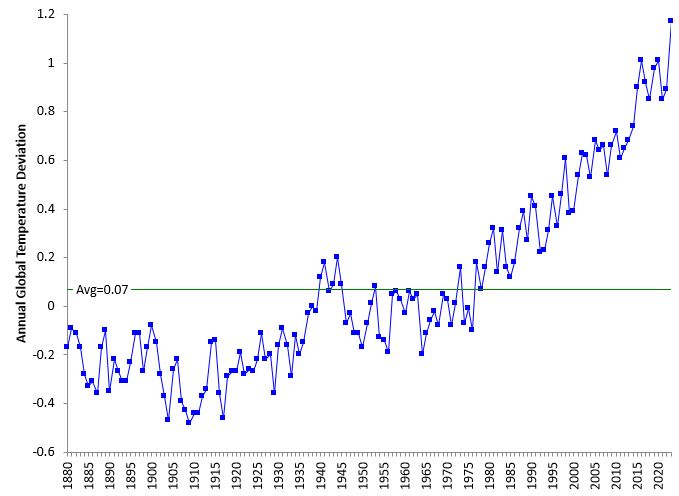
There is definitely an upward trend in the temperature deviation data. You can see the jump from 2022 to 2023 (the last two points on the chart). The difference between 2022 and 2023 was 0.28. This ties for the largest change from year to year since 1977.
Note: all the charts in this publication were made with the SPC for Excel software.
Global Warming as a Trend Control Chart
Since 1987, the annual temperature deviations have been increasing quickly. The data since 1987 has been analyzed using a trend control chart. The trend control chart is similar to the basic control chart except that the center line is replaced by the best fit line as determined by regression. Again, see our previous publications listed below for more information.
Figure 2 shows the annual global temperature deviation as a trend control chart. An individuals control chart is being used to analyze the results. The moving range chart is not included in the analysis – just the X chart.
Figure 2: Annual Global Temperature Deviations Trend from 1987 – 2023
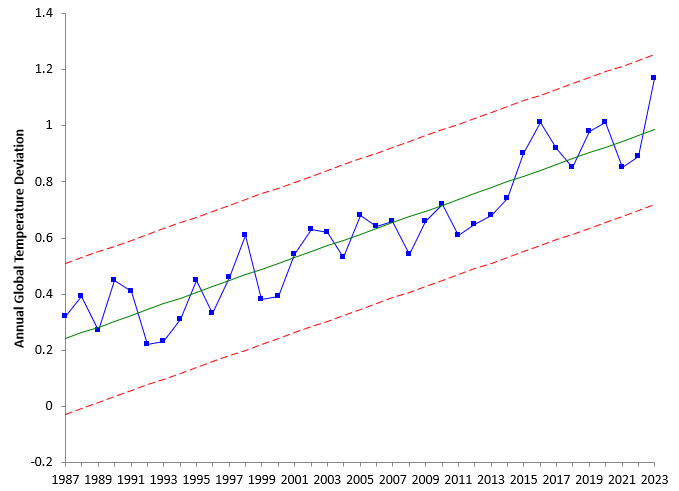
The chart appears to be in statistical control – there are no points beyond the control limits and no patterns, such as a run of 8 points or more above or below the average. Since it is in control, we can expect the annual global temperature deviation to continue to increase.
You can use the center line to estimate the annual global temperature deviation for 2024. The best fit equation for the center line is given by:
Annual Global Temperature Deviation = -40.87924 + 0.020695(Year)
The coefficient on Year represents the average change per year. So the annual global temperature deviation is increasing by 0.020695 degrees per year on average. The predicted value for 2024 is:
Annual Global Temperature Deviation = -40.87924 + 0.020695(2024) = 1.00744
Global Warming as Step-Changes in a Control Chart
Over the past several publications on global warming we have been looking at the increase, not as a trend, but as a series of step-changes in a control chart. Figure 3 shows a basic control chart.
Figure 3: Annual Global Temperature Deviations from 1987 – 2023
Not a lot of use, is it? Trying to apply a basic control chart to trending data doesn’t work too well. But on second look, this chart makes it easier to see some periods of stable annual global temperature deviations. Previous publications (see below) have shown that the deviations can be divided up into periods of time when the deviations were not increasing or decreasing. They were consistent during those periods. Do you see periods of consistent deviations in Figure 3?
For example, consider the data from 2015 (the first point above the upper control limit) to 2023 (the last point). This data represents a step change upward from the previous data. From 2015 to 2022 (excluding 2023, the last point), the deviations are not increasing or decreasing. They are stable. Look at the chart: this has happened before, where there is a period of “constant” temperature deviations followed by a step-change up. The previous period was from 2002 – 2014, which represents 13 years. Another period is from 1987 to 2001, which represents 15 years.
Deciding where the breaks occur between periods of stability depends on how you interpret the control chart. Suppose based on Figure 3, we decide that will we have three periods of stability: 1987 to 2001, 2002 to 2014 and 2015 – 2022. We can then split the control chart into these three periods. Note that the year 2023 is not included in the calculations. The last period’s control limits are based on the 2015 – 2022 data.
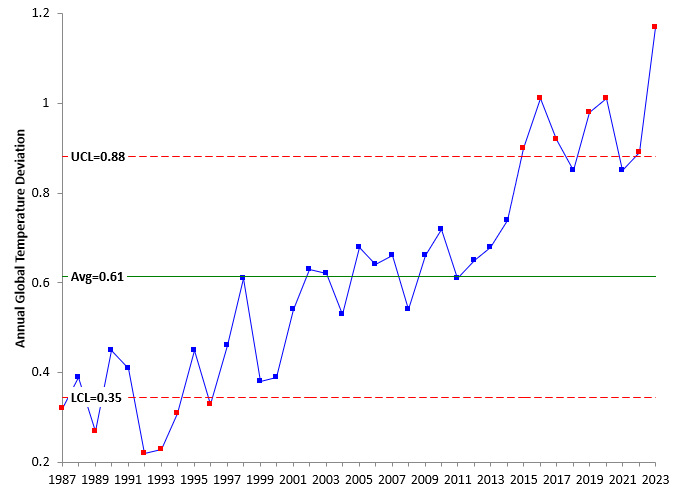
Figure 4 shows the deviation data with the consistent periods separated by changing control limits.
Figure 4: Annual Global Temperature Deviations from 1987 – 2023 with Step Changes
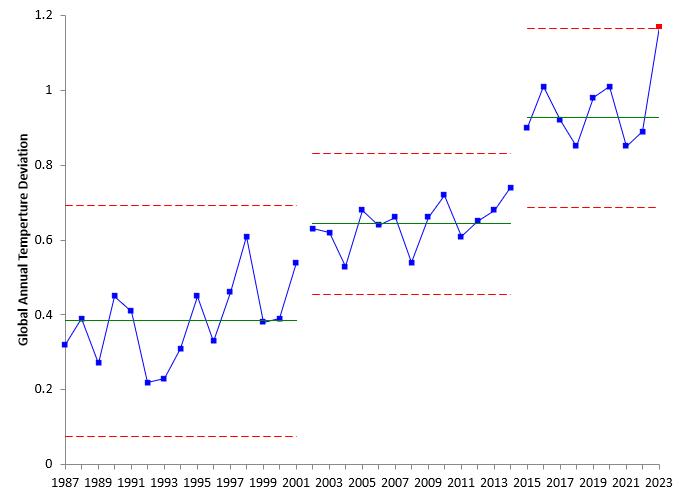
Figure 4 shows the data could be looked at by finding periods of stable deviations and then seeing where those changed. Each of the three periods represent times when the deviations where not increasing or decreasing – but staying the “same.”
Now, 2023 is an out of control point. It is above the upper control limit, using 2015 to 2022 as baseline for this period. So, yes, this may well be the start of another period at higher temperature deviations that will stay stable for several years. For how long, no one knows. It is interesting to note that the span for the three stable periods before step changes in Figure 4 are 15, 13 and 8 years. The change may be accelerating. But there is for sure no indication that the earth’s temperature is decreasing.
Past Global Temperature Publications
We have eight previous publications on using control charts to analyze global temperature. These are briefly described below.
SPC and Global Warming (December 2015): This publication used global temperature data referred to as dTs data. These are data based on the meteorological station data. This publication showed the periods where the global temperature was essentially stable. There were five such periods, each followed by a sudden increase in the global temperature. It also showed the trend that began in 1997. This trend was used to predict the global temperature for 2016.
Trend Control Charts and Global Warming (January 2016): This publication expanded on how to use trend control charts and the calculations involved. Global warming data was used as an example.
SPC and Global Warming Update (February 2017): This publication updated the results with the 2016 data. The data used in this analysis was the LOTI (land-ocean temperature index) data. The LOTI data are considered more accurate than the dTs data used in the first publication listed above. This is also where it was discovered that the historical data had changed somewhat since it was examined in 2015.
SPC and Global Warming – 2017 Update (March 2018): This publication updated the results through 2017 data.
Global Warming: A Trend or Step Changes? (June 2020): This publication focused on if it was better to use a trend control chart for the period since 1997 or to use a series of step changes in the process.
SPC and Global Warming: 1880 2020 (January 2021): This publication was similar to our first one. The control charts were updated to reflect using the LOTI data instead of the dTs data. There are differences between the two datasets, and it does not appear that GISS uses the dTs data anymore. It might surprise you that, over the time span from 1880 to 2020, there have only been stable periods. The first five stable periods had consistent, predictable temperatures. The last period has also been consistent – except the global temperature is trending up in a fairly predictable pattern.
SPC and Global Warming: 1880-2021 (January 2022): This publication continued our look at global warming by including the 2021 data. The model from our previous publication had predicted an annual global temperature deviation in 2021 of 0.948. The actual number was 0.85. The previous publication used a trend control chart for the data from 1987 through 2020. The new data for 2021 shows that the global deviations over the past 7 years are stable – the global temperature is not getting hotter or cooler. It also showed that this pattern has existed before. There is a period where the temperature is stable – not significantly changing – and then there is a step change upward. The chart shows no reason to believe that this pattern will not continue over time – at least for now. The two patterns before the last 7 years lasted 15 and 13 years.
SPC and Global Warming: 1880-2022 (January 2023): this publication added the data from 2022 to the analysis. The 2022 data showed that the years since 2015 continued to be consistent and predictable. The model for 2022 predicted a value of 0.97 for 2023 – way below the actual of 1.17.
Summary
2023 was the hottest year on record since 1880. The difference in annual global temperature deviation from 2022 to 2023 matched the highest ever difference since 1880. The trend control chart showed that the deviation (1.17) in 2023 was in statistical control – indicating that globally warming continues to increase over time, currently at a predictable rate of about 0.02 °C per year.
Examining the results by dividing the trend into periods of stable deviations shows that 2023 was an out of control point based on data from 2015 – 2022. It could be that a new level of stability is forming and there is no telling how long that will last. It may be accelerating since the length of the three periods of stability in Figure 4 are 15, 13 and 8 years.