SPC for Excel Help
Home » SPC for Excel Help

Our SPC for Excel Software help pages are designed to help you answer questions you may have about how to use the software. Our SPC software simplifies statistical charting and analysis, but there are many options that you may want to take advantage of. Our help pages will assist you in doing that. This home help page follows the SPC for Excel menu. If you need more help, contact us at support@spcforexcel.com.
- Frequency: creates a Pareto diagram based on categories and frequencies
- Defect: creates a Pareto diagram from a list of defects
- Variable and Two-Level: creates a Pareto diagram for defects for each variable (such as day, afternoon, and night shift) or one two-level Pareto diagram


- Attribute Control Charts: create one of the attribute control charts listed below
- Variable Control Charts: create the variable control charts listed below
- Subgroup Charts: create a control chart using data in subgroups
- Individuals Charts: create a control chart using individual data points
- Between/Within Charts: create a control chart when the within subgroup variation is significantly different than the between subgroup variation
- Time Weighted Charts: create a control chart used to keep process on target
- Multivariate Charts: create a control chart tracking more than one variable
- Updating Control Charts with New Data: how to update a control chart with new data
- Control Chart Actions: actions you can take on a completed control chart
- Split/Remove split control limits at this point
- Remove from/Add back this point to the calculations
- Add or replace comment
- Delete existing comment
- Remove all points beyond the control limits from the calculations
- Add back all points beyond the control limits to the calculations
- Select subgroup (sample) range on which to base average and control limits
- Select the subgroup (sample) identifier at which to start the chart
- Resize charts to fit screen
- Reset chart’s value axis
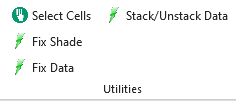
- Make subgroups from a single column

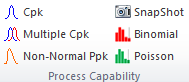
- Cpk Charts: creates a chart with the histogram, normal distribution, and specifications along with the statistics (Cpk, Cp, Ppk, Pp, etc.)
- Multiple Cpk Charts: creates multiple Cpk charts at one time from data in a table
- Non-Normal Ppk Charts: handles non-normal data; creates a chart with the histogram, distribution curve, and specifications along with the statistics (Ppk, Pp, etc.)
- Normal Process Capability SnapShot: creates a snapshot in time of your process with a Cpk chart, control chart, normal probability plot and statistics
- Non-Normal Process Capability SnapShot: creates a snapshot in time of your process (data is non-normal) with a Ppk chart, control chart, P-P plot and statistics
- Binomial Capability: creates a % defectives histogram, p control chart, cumulative % defective chart, % defectives versus subgroup size chart and statistical metrics
- Poisson Capability: creates DPU histogram, u control chart, cumulative DPU chart, DPU versus subgroup size chart, and statistical metric
- How to update charts with new data or change chart options
- Scatter: creates a scatter diagram between two variables
- Fishbone: creates a cause and effect diagram
- Regression: options include multiple linear, stepwise, forward selection, backward elimination, Poisson and binary logistic regressions

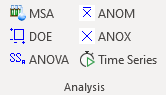
- Measurement Systems Analysis: analyze how "good" your measurement system is
- DOE (Design of Experiments): determine which factors significantly impact a response variable
- ANOVA (Analysis of Variance): determine which factors significantly impact a response variable using full models up to five factors
- Analysis of Means (ANOM): determine which means are significantly different than others
- Analysis of Individual Values (ANOX): determine if individual values are homogenous
- Time Series Analysis: forecast future values of a time series
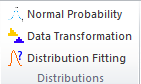
- Normal Probability Plot: determine if the data are normally distributed; with a normality test statistic (such as the Anderson-Darling statistic)
- Data Transformation: transform the data to a normal distribution
- Distribution Fitting: fit the data to different distributions
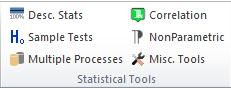
- Descriptive Statistics: generate descriptive statistics for sets of data
- z and t One/Two Sample Tests
- Equivalence Tests
- Proportion Tests
- Poisson Rate Tests
- Outlier Tests
- Sample Size/Power
- Comparing Processes: compare the means and variances of multiple processes
- Correlation: explore the correlation between sets of data
- Nonparametric techniques: distribution-free statistical techniques
- Miscellaneous Tools: miscellaneous statistical techniques
- Export charts to Word or PowerPoint

- Check for program update, link to this page, and About SPC for Excel information